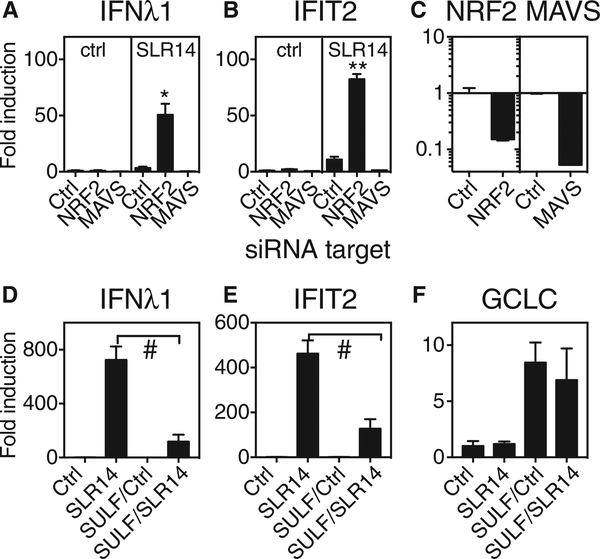
Figure 3. Effect of NRF2 Knockdown or NRF2 Activation on Interferon and ISG Response to RIG-I Ligand SLR14.
(A and B) Primary human bronchial epithelial cells were transfected with siRNA targeting NRF2 or MAVS or with control siRNA (RNA-induced silencing complex [RISC]-free). After recovery for four days, cells were transfected with the RIG-I ligand SLR14 and then incubated for 6 hr at 37°C, followed by RNA isolation and qRT-PCR for mRNA encoding IFNλ1 (A) and IFIT2 (B). Significant difference between transcript levels in control siRNA-treated and NRF2-siRNA-treated cells by unpaired t test is indicated with asterisks (*p = 0.02; **p = 0.003).
(C) qRT-PCR was also performed on unstimulated cells following NRF2 or MAVS knockdown to check knockdown efficiency.
(D–F) Primary human nasal epithelial cells were pretreated with 10 μM sulforaphane (SULF) for 18 hr. After 3 hr recovery in medium only, cells were transfected with SLR14. After 5 hr incubation at 37°C, cells were collected for RNA isolation and qRT-PCR for mRNA encoding IFNλ1 (D), IFIT2 (E), or GCLC
(F). Graph shows untreated cells with no stimulation (Ctrl) or SLR14 exposure (SLR14) or sulforaphane-pretreated cells with no stimulation (SULF/Ctrl) or SLR14 exposure (SULF/SLR14). Significant differences between control and SULF pretreated cells by unpaired t test are indicated (#p < 0.0001). Bars show mean and SD of 2–4 replicate experimental wells per condition. Graph titles indicate mRNA assessed by qRT-PCR. Results are representative of at least three independent experiments.
See also Figure S4.

