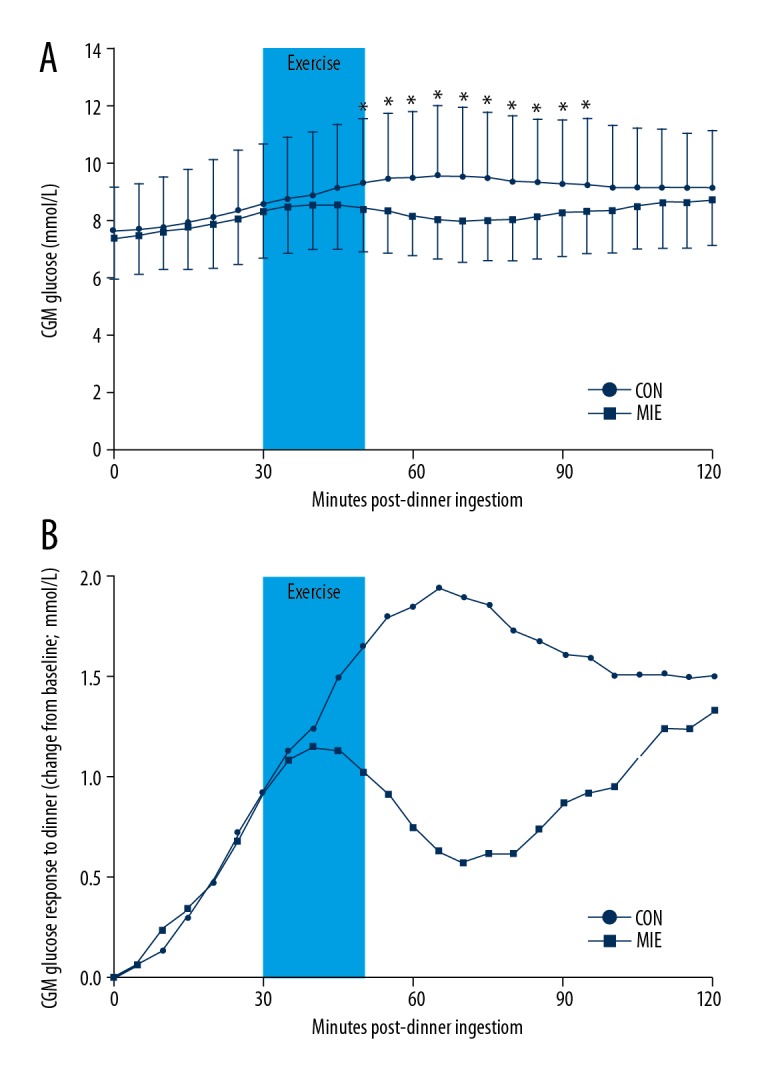
Figure 1.

The average CGM values (A) and the average postprandial CGM glucose change from baseline (B) for moderate-intensity exercise (MIE) condition and non-exercise as control (CON) condition during the postprandial dinner period. Time 0 represents the time of first bite. Post-dinner exercise began half an hour after first bite and lasted 20 minutes (light blue squares). * Significantly different compared with the control condition (P<0.05).
