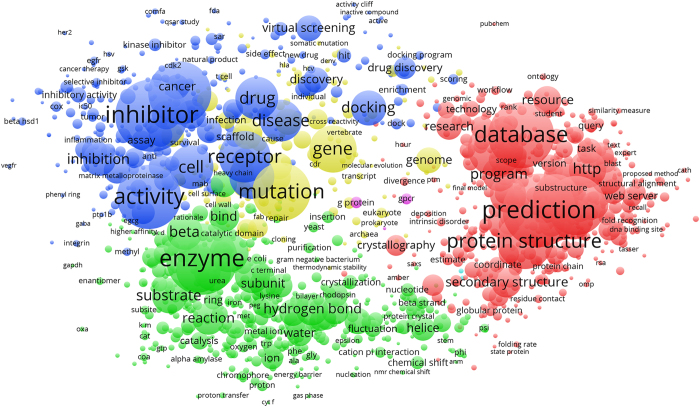
Figure 4. Network visualization of term occurrences extracted from abstracts and titles of 2000-2016 publications citing the inaugural Berman et al. (2000) reference.
Figure created using VOSviewer46. A threshold cutoff of 30 as number of term co-occurrence was used. The location of citation keywords is based on their overall position within the network; keywords located in more common regions of the map have higher network connectivity, i.e., they are more interconnected with surrounding keywords. Darker colors and font size represent keywords that appear more frequently among citations. Keywords are clustered in four main regions: red corresponds to keywords representing “computational” use of the data; green corresponds to 3D-structure and mechanism of action; blue corresponds to function; and yellow corresponds to keywords related to genetics and genomics.

