
FIGURE 4.
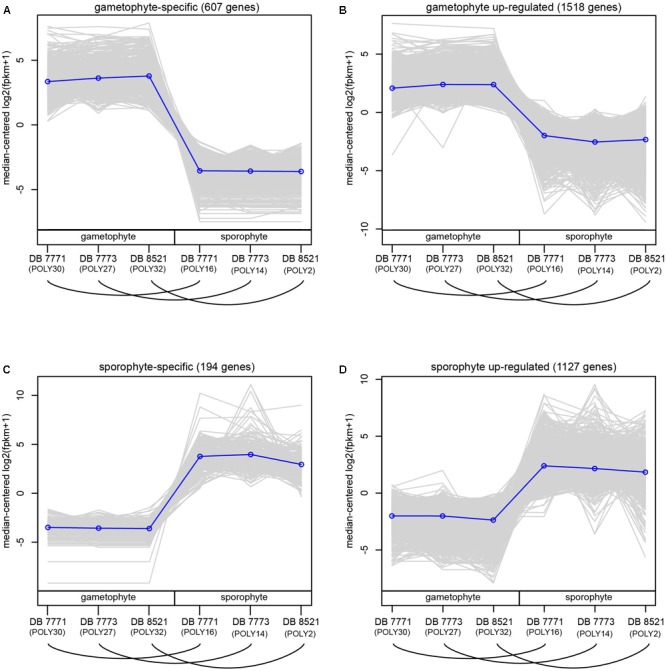
Normalized expression (log2-transformed FPKM + 1) of genes assigned to four categories of differential expression using the criteria of log2FC ≥ 2 and padj ≤ 0.002. Each gray line represents the expression level of a particular gene relative to the median expression level of all genes in that expression category. Blue lines represent the median expression level for each expression category. Samples are labeled as gametophyte or sporophyte, with an arched line connecting samples derived from the same Polypodium amorphum individual. (A) gametophyte-specific genes; (B) gametophyte up-regulated genes; (C) sporophyte-specific genes; (D) sporophyte up-regulated genes.