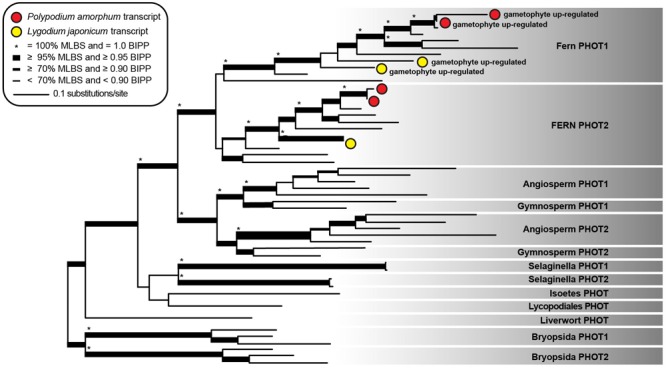
FIGURE 6.

Phylogram of the best maximum likelihood tree of phototropin sequences. Shading indicates taxonomic specific phototropin clades as described in Li et al. (2015). Red and yellow circles represent single transcripts from the ferns Polypodium amorphum and Lygodium japonicum, respectively, that are up-regulated in the gametophyte phase. Node support values are as indicated in the inset legend. MLBS, maximum likelihood bootstrap value; BIPP, Bayesian inference posterior probability.
