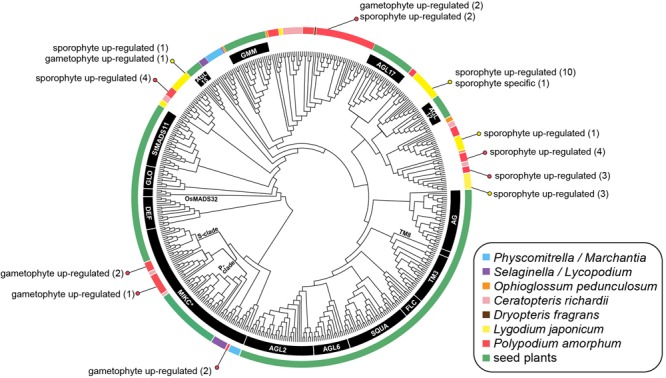
FIGURE 8.

Cladogram of the best maximum likelihood tree of land plant Type II MADS-box sequences. Specific MADS-box genes, as described by Kwantes et al. (2011) and Gramzow and Theissen (2013), are indicated by black lines or along branches. Colored lines indicate the taxonomic identity of particular sequences (see inset legend). Colored dots and text describes the number of transcripts that are phase-specific or phase up-regulated in the ferns Polypodium amorphum (red) and Lygodium japonicum (yellow). Node support values are provided at Figshare (doi: 10.6084/m9.figshare.c.4229141).
