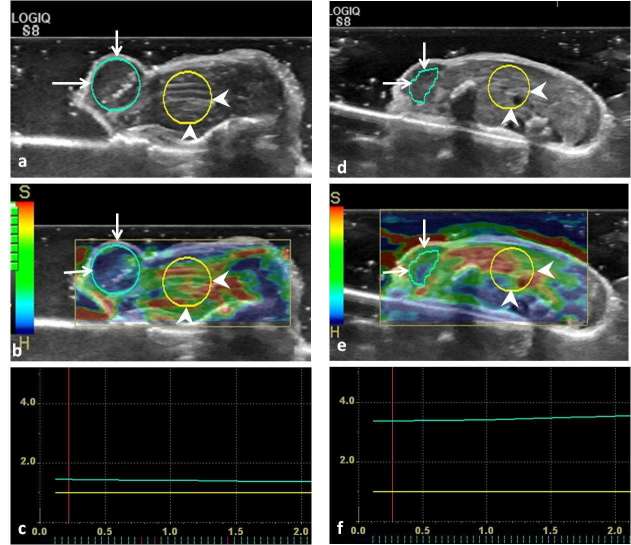
Figure 1.
Representative strain elastograms for estimating the strain ratio of the pre-treatment and post-treatment xenograft breast tumors in nude mice. (a, d), the B-mode ultrasound images before and after treatment, respectively. In (a, b, d, e), the regions of interest of xenograft tumor and the adjacent liver are labeled with long arrows and arrowheads, respectively. (b, e), the strain elastograms before and after treatment, respectively. (c, f), the strain ratios (the ratio of tumor to the liver stiffness within ROI at the same level) of pre-treatment and post-treatment tumor were 1.51 and 3.50, respectively. ROI, region of interest.

