
Figure 3. .
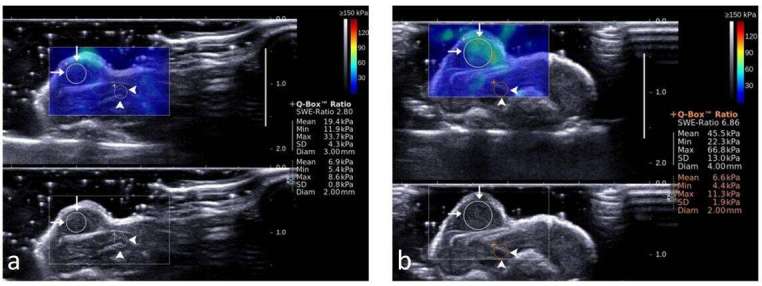
Representative shear wave elastograms of xenograft tumors in mice. (a) Before treatment, SWE ratio was 2.81, mean value of SWE in the tumor was 19.4 Kpa, max value 33.7 Kpa, SD 4.3 Kpa, mean value of SWE in the adjacent liver was 6.9 Kpa, max value 8.6 Kpa, SD 0.8 Kpa. (b), after treatment with cisplatin (2 mg kg–1) + paclitaxel (10 mg kg–1) for 5 days, SWE ratio was 6.86, mean value of SWE in the tumor was 45.5 Kpa, max value 66.8 Kpa, SD 13.0 Kpa, mean value of SWE in the adjacent liver was 6.6, max value 11.3 Kpa, SD 1.9 Kpa. ROI of xenograft tumor (long arrows) and the adjacent liver (arrow heads) are shown in circles. SD, standard deviation; SE, strain elastography; SWE, shear wave elastography; ROI, region of interest.