
Figure 4. .
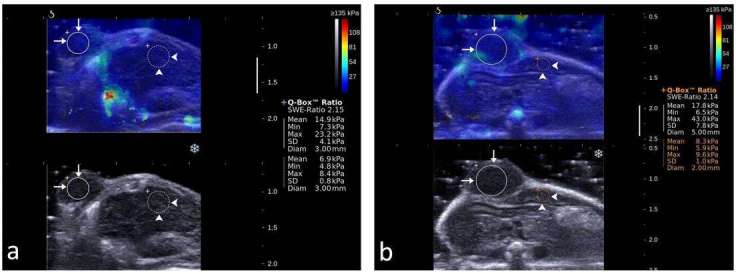
Representative shear wave elastograms of control xenograft tumors in mice. (a) before receiving sterile saline, SWE ratio was 2.15, mean value of SWE in the tumor was 14.9, max value 23.2 Kpa, SD 4.1 Kpa, mean value of SWE in the adjacent liver was 6.9Kpa, max value 8.4 Kpa, SD 0.8 Kpa. (b) after receiving sterile saline, SWE ratio was 2.14, mean value of SWE in the tumor was 17.8, max value 43.0 Kpa, SD 7.8 Kpa, mean value of SWE in the adjacent liver was 8.3 Kpa, max value 9.6 Kpa, SD 1.0 Kpa. ROI of xenograft tumor (long arrows) and the adjacent liver (arrowheads) are shown in circles. SWE, shear wave elastography. ROI, region of interest.