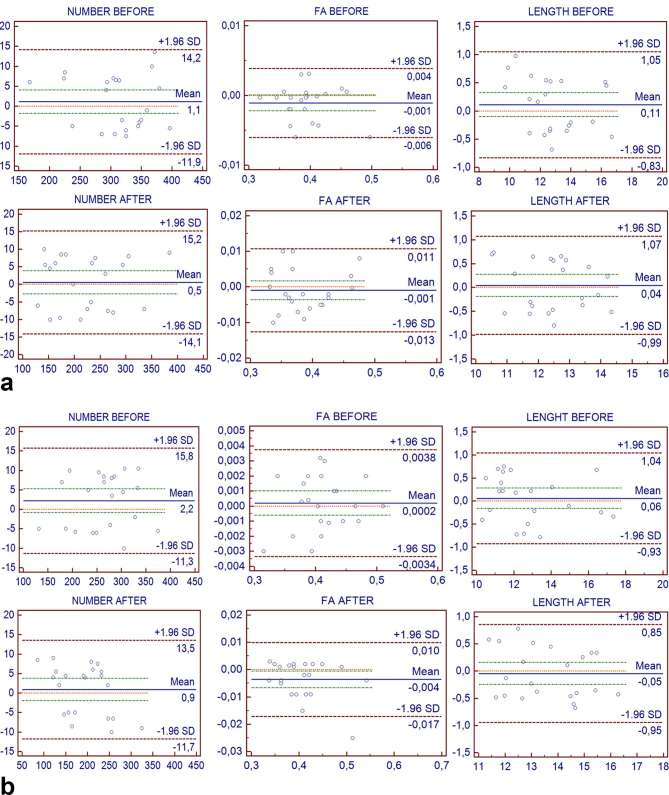
Figure 5.
(a) Bland–Altman plots (with 95% confidence interval) of the two repeated DTI measurements of Observer 1 for the number, the FA values and the length of the fiber tracts before and after radical prostatectomy. x-axis = mean of first and second measurement of Observer 1. y-axis = differences between first and second measurement of Observer 1. (b) Bland–Altman plots (with 95% confidence interval) of the two repeated DTI measurements of Observer 2 for the number, the FA values and the length of the fiber tracts before and after radical prostatectomy. x-axis = mean of first measurement and second measurement of Observer 2. y-axis = differences between first and second measurement of Observer 2. DTI, diffusion tensor imaging; FA, fractional anisotropy.

