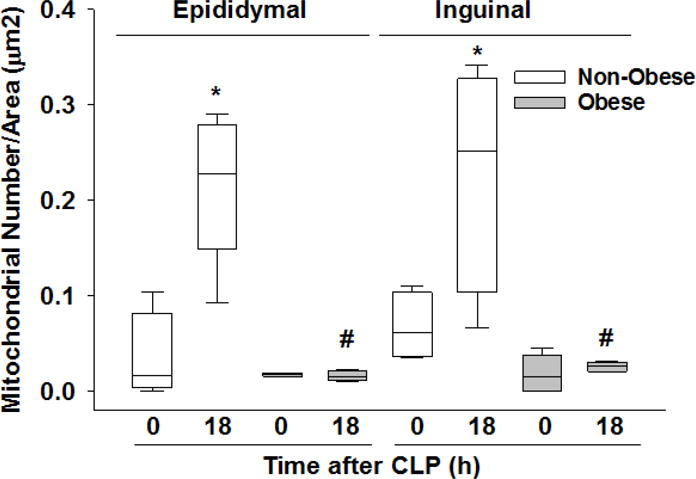
Figure 6. Mitochondrial density in epididymal and inguinal WAT at various timepoints after CLP.

Mitochondrial density as calculated by dividing the total number of mitochondria in a predefined magnification (×3000, TEM) by the total measured surface area. All mice were 17 weeks of age at the time of harvest. *p≤0.05 vs time 0h within diet, #p≤0.05 vs non-obese mice by 2-way ANOVA. n= 4-5 mice in each group.
