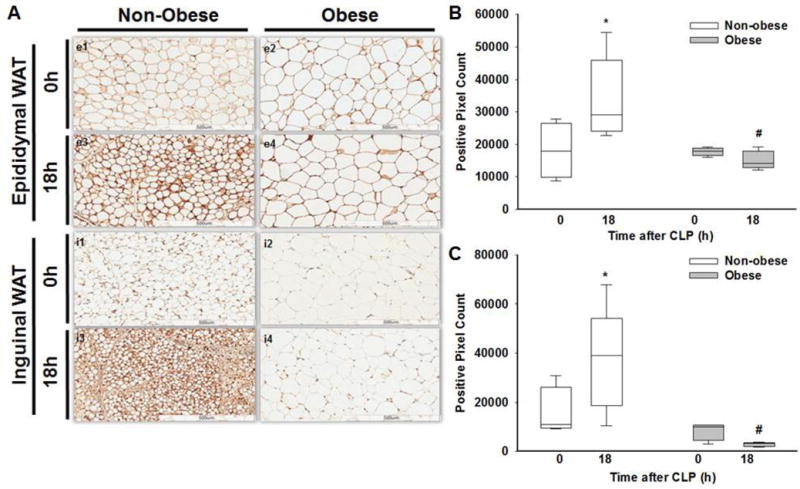
Figure 8. WAT UCP1 expression by immunohistochemistry.

(A) Representative images of epididymal WAT UCP1 IHC staining in non-obese mice at 0h (e1), 18h (e3) and in obese mice at 0h (e2), 18h (e4), after sepsis. Inguinal WAT UCP1 IHC staining in non-obese mice at 0h (i1), 18h (i3) and in obese mice at 0h (i2), 18h (i4) after sepsis. Quantification of (B) eWAT and (C) iWAT UCP1 staining using ImageScope software to determine positivity staining of UCP1 intensity in non-obese and obese mice at 0 and 18h after CLP. All mice were 17 weeks of age at the time of harvest. *p≤0.05 vs time 0h within diet, #p≤0.05 vs non-obese mice by 2-way ANOVA. n= 4-5 mice in each group.
