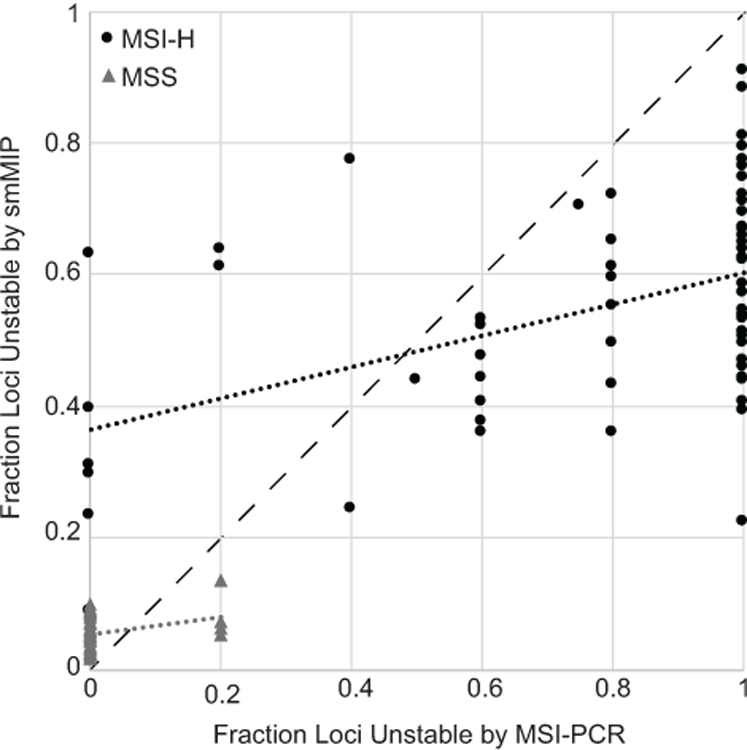
Figure 4. Quantitative correlation of instability quantified by smMIP and MSI-PCR.

The fraction of unstable loci quantified by smMIP (Y-axis) is shown separately for MSS and MSI-H tumors as a function of the fraction of unstable loci detected by MSI-PCR (X-axis). The dashed black line indicates a theoretical perfect correlation between the two measurements. Linear trend lines are displayed separately for MSS and MSI-H populations.
