
Figure 1.
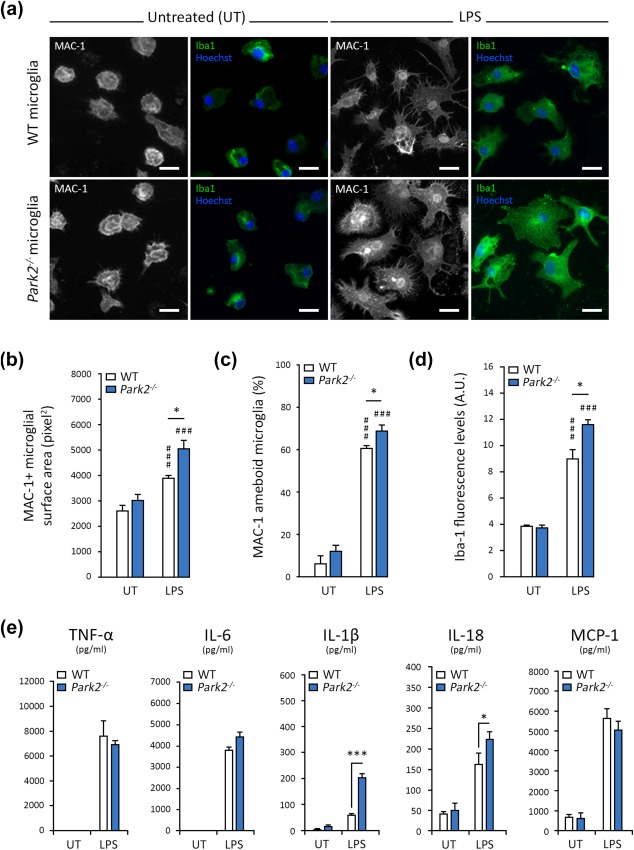
Park2−/− microglia are more strongly activated than WT cells following exposure to the bacterial endotoxin LPS. (a–d) Representative images illustrating the activation of microglial cells exposed to LPS, as explored by automated microscopy assessing the cell surface area (stained for MAC‐1) and Iba1 intensity (a), with the corresponding quantifications (b–d). The microglial surface area (in pixels) of LPS‐treated Park2−/− microglia (n = 10) is larger than that of WT cells (n = 10; b). This modification is associated with a higher percentage of MAC‐1+ microglia with an ameboid morphology (c) and stronger Iba1 staining intensity (d). (e) LPS triggers release of TNFα, IL‐6, IL‐1β, IL‐18, and MCP‐1, quantified by ELISA with normalization according to cell numbers (AU), into the supernatant of WT microglia (n = 10). Larger amounts of IL‐1β and IL‐18 are released by Park2−/− cells (n = 10). n is the number of independent experiments. Error bars indicate the SEM. *p < .05, **p < .01, ***p < .001. # versus the corresponding untreated control (UT) unless otherwise indicated. Scale bars: 10 µm