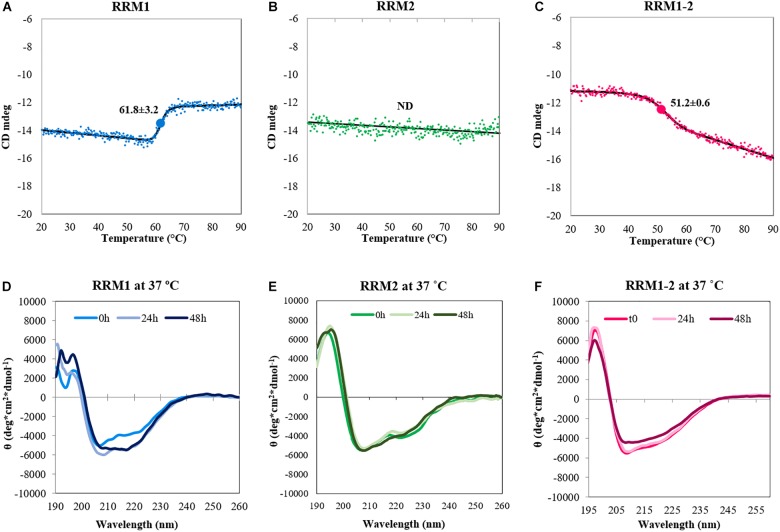
FIGURE 2.
Conformational changes of the TDP-43 constructs upon heat treatment. Top panel: Denaturation curves determined by CD spectroscopy by recording the intensity values of the band at 222 nm as a function of temperature for RRM1 (A), RRM2 (B), and RRM1-2 (C). The spectrum associated to the denaturation of RRM1 cannot be considered reliable, due to the large amount of precipitation observed. The value of the CD signal at 222 nm does not change for RRM2 indicating (together with the data in Figure 1) no thermal unfolding. The apparent Tm of RRM1-2 is 51.2 ± 0.6°C. Bottom panel: Kinetics of secondary structure variations at 37°C for RRM1 (D), RRM2 (E), and RRM1-2 (F). The data were acquired in low-salt potassium phosphate buffer.

