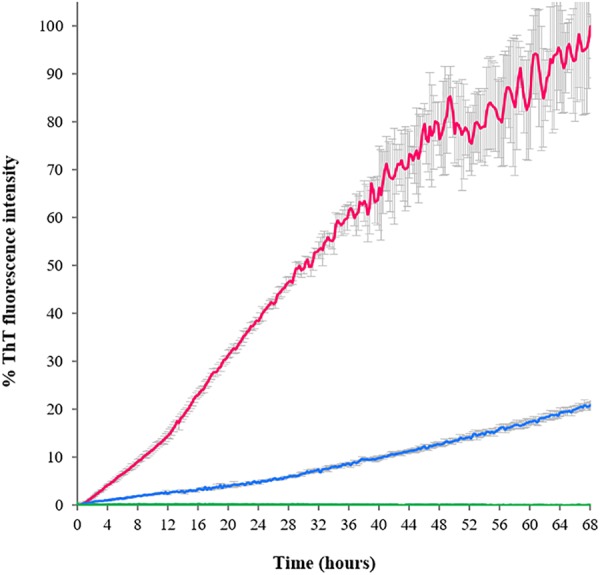
FIGURE 4.

Aggregation kinetics of the TDP-43 constructs determined according to the ThT emission fluorescence at 485 nm as a function of time. Blue: RRM1; green: RRM2; and fuchsia: RRM1-2. The fluorescence values are reported as percentage, where 100% is the highest ThT-associated fluorescence value obtained for the assay, corresponding to RRM1-2 at 68 h.
