
FIGURE 7.
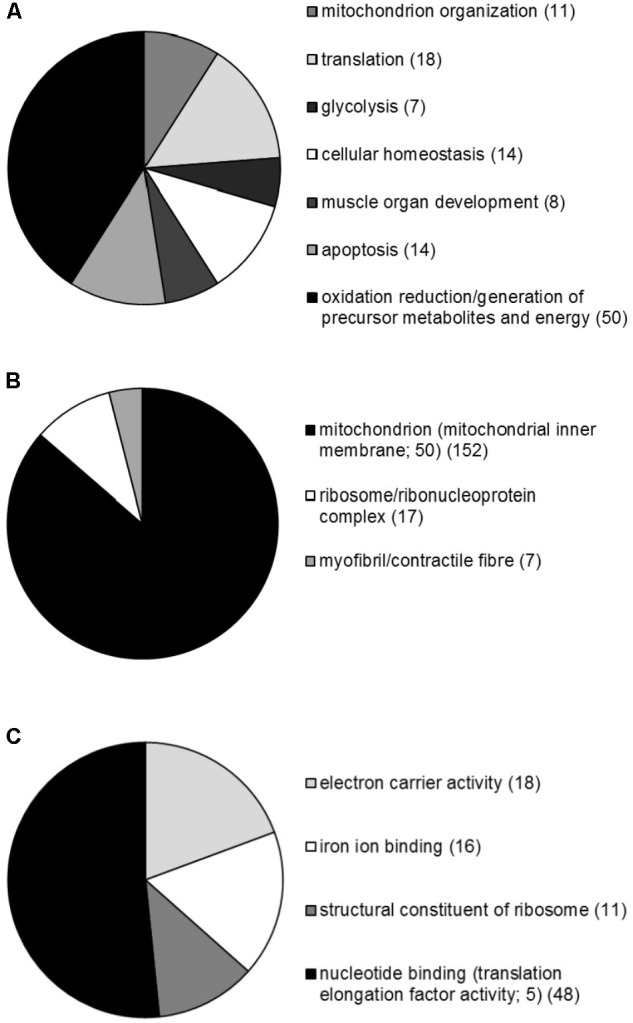
Overview of the GSEA performed on genes commonly regulated by both PGC-1α and PGC-1β in C2C12 myotubes. Proportional representation of gene numbers significantly enriched in GO-related (A) biological processes, (B) cellular compartment, and (C) molecular functions with the number of genes indicated in brackets. The proportion of genes making up the specific sub-groups; CC GO term mitochondrial inner membrane, and MF GO terms translation elongation factor activity are also indicated.