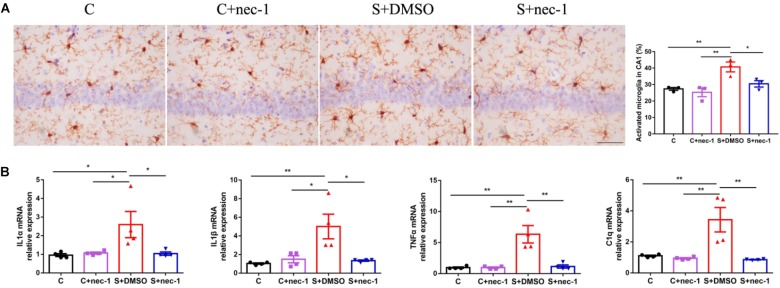
FIGURE 2.
Inhibiting RIP1 using necrostatin-1 limited neuroinflammation induced by chronic stress in D-galactose-induced aging mice. (A) Representative images of Iba-1 staining (yellow) in the CA1. Scale bar = 50 μm. Data are expressed as the mean ± standard error of mean (SEM). ∗p < 0.05; ∗∗p < 0.01; (n = 3, one-way ANOVA followed by Turkey’s post hoc comparisons tests). (B) qPCR analysis of mRNA levels of inflammatory factors (IL-1α, IL-1β, C1q, and TNF-α) in the hippocampus. Data are expressed as the mean ± SEM. ∗p < 0.05; ∗∗p < 0.01; (n = 4, one-way ANOVA followed by Turkey’s post hoc comparisons tests).

