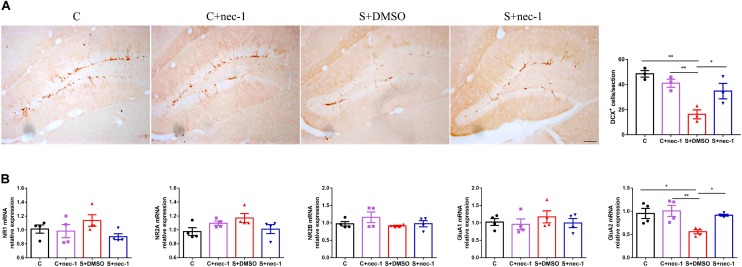
FIGURE 4.
Effects of Inhibiting RIP1 using necrostatin-1 on neuroplasticity. (A) Representative pictures of DCX+ cells in the dentate gyrus (DG). DCX+ cells were counted in the subgranular zone (SGZ) of the entire DG. Scale bar = 50 μm. Data are expressed as the mean ± standard error of mean (SEM). ∗p < 0.05; ∗∗p < 0.01; (n = 3, one-way ANOVA followed by Turkey’s post hoc comparisons tests). (B) qPCR analysis of mRNA levels of NMDA receptors (NR1, NR2A, and NR2B) and AMPA receptors (GluA1 and GluA2) in the hippocampus. Data are expressed as the mean ± SEM. ∗p < 0.05; ∗∗p < 0.01; (n = 4, one-way ANOVA followed by Turkey’s post hoc comparisons tests).

