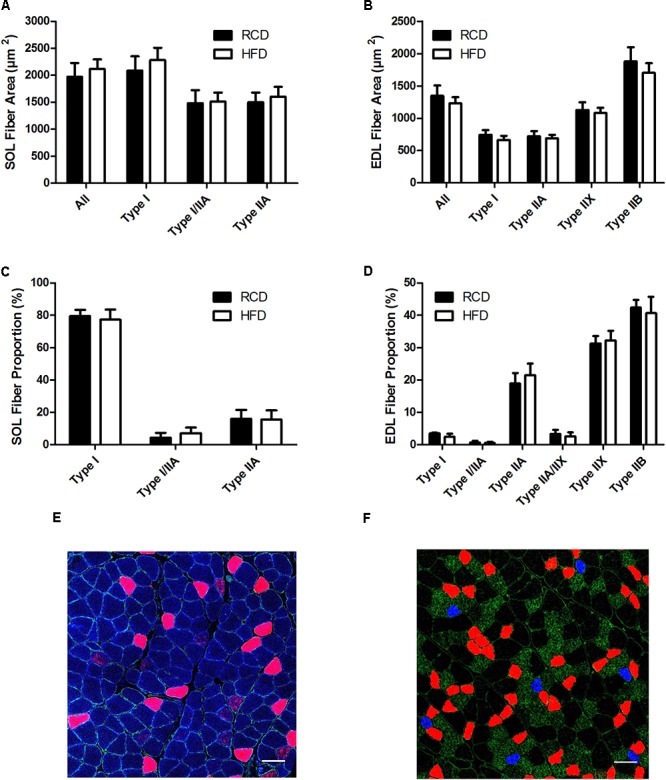
FIGURE 2.

Cross-sectional areas of different fiber types in the SOL (A) and EDL (B) muscles of young rats submitted to HFD or RCD for 14 days. Fiber type proportions in the SOL (C) and EDL (D) muscles are shown. In situ immunolabeling of a SOL (E) and EDL (F) muscle cross-section for myosin heavy chains type I (blue), IIa (red), IIb (green), and IIx (black) are shown. Unpaired Student’s t-tests were used to compare values between both groups. Results are presented as means ± SD for n = 6–7. Scale bar: 100 μm.
