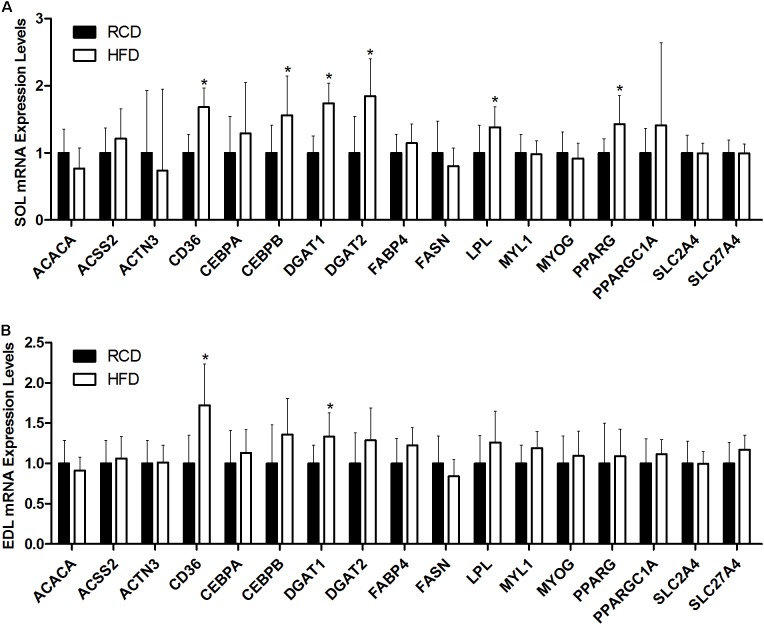
FIGURE 5.
Expression levels of genes implicated in lipid and muscle metabolisms in the SOL (A) and EDL (B) muscles of young rats submitted to HFD or RCD for 14 days are shown. Results are presented as mean fold change ± SD of the HFD group compared to the RCD group using the ΔΔCT method for n = 15; ∗indicates significant difference between the two groups (P < 0.05).

