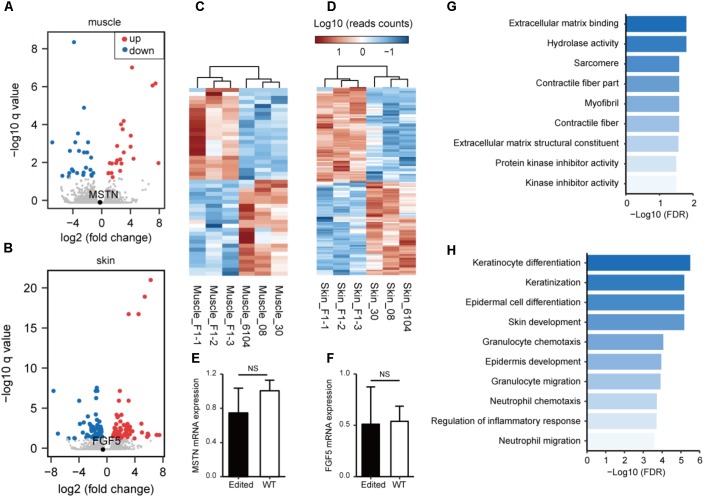
FIGURE 3.
Transcriptome analysis of gene targeting in the edited and WT animals. A volcano plot of gene expression patterns is shown in the edited and WT animals using muscle (A) or skin (B) tissues. (C) Heatmap of DEGs demonstrating unsupervised hierarchical clustering of MSTN-edited and WT animals in muscle tissues. (D) Heat maps of DEGs demonstrating unsupervised hierarchical clustering of FGF5-edited and WT animals in muscle tissues. Quantitative RT-PCR validation of the mRNA expression of MSTN in muscle (E), and FGF5 in skin tissues (F). Enriched Gene Ontology terms using DEGs revealed in muscle (G) or skin (H) tissues.

