FIGURE 2.

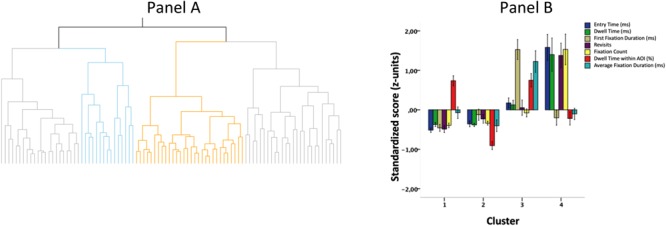
Dendrogram illustrating the number of clusters (A) and cluster profiles (B). Error bars on B denote standard errors of the mean.

Dendrogram illustrating the number of clusters (A) and cluster profiles (B). Error bars on B denote standard errors of the mean.