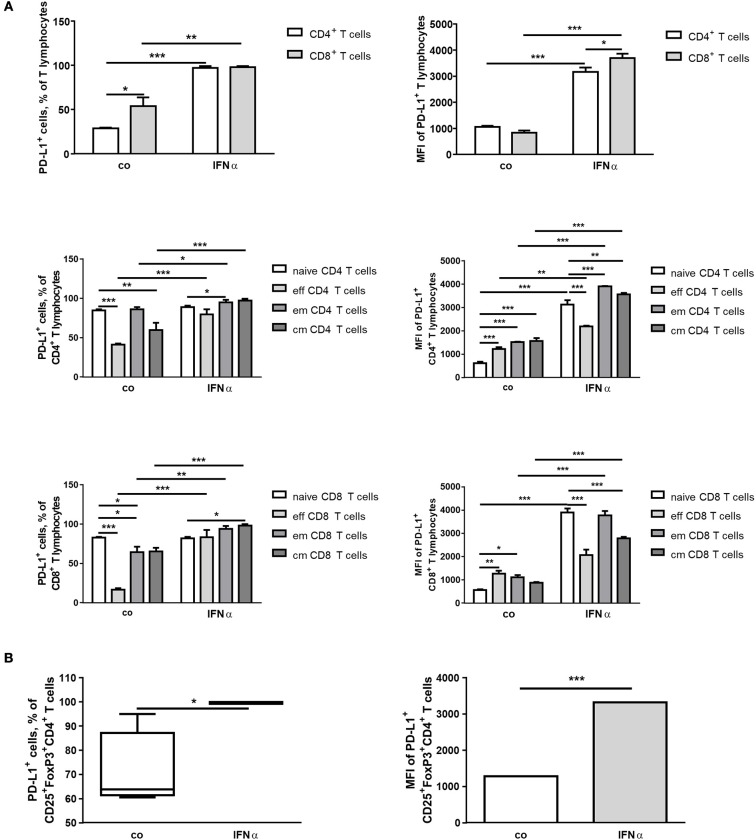
Figure 2.
IFNα up-regulates PD-L1 expression on different T-cell populations ex vivo. FACS analysis of PD-L1 expression on the surface of different lymphoid immune cells from spleens of healthy mice. Splenocytes were isolated, treated for 24 h with 1,000 U/ml IFNα and investigated by flow cytometry. The results are presented as interleaved bars (A) or as box and whiskers plot or column bar graph (B) and statistically analyzed using two-way ANOVA or unpaired T-tests, n = 4, *p < 0.05, **p < 0.01, and ***p < 0.001.

