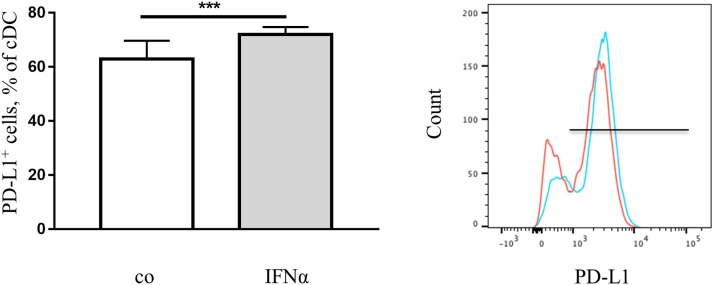
Figure 3.
IFNα up-regulates PD-L1 expression on DC in vivo. FACS analysis of PD-L1 expression on the surface of DC from spleens of healthy mice with or without treatment with IFNα. Splenocytes were isolated and examined using flow cytometry. The results are presented as percent of positive cells in a column bar graph and statistically analyzed using unpaired T-test, n = 10, ***p < 0.001. A representative FACS histogram (red-control, blue-IFNα) is shown.

