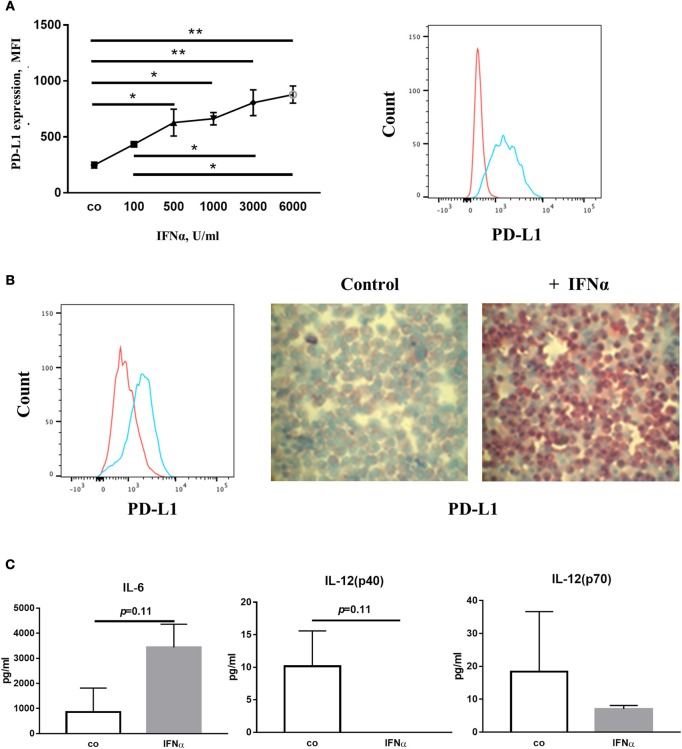
Figure 4.
IFNα up-regulates PD-L1 expression on human dendritic cells. (A) FACS analysis of PD-L1 expression on the surface of mDC. Myeloid DC were isolated, treated for 24 h with IFNα and analyzed with flow cytometry. The results are presented as column mean, error bars and mean connected and statistically analyzed using ordinary one-way ANOVA with the Tukey's multiple comparisons post-test, n = 2, *p < 0.05 and **p < 0.01. (B) FACS analysis and Immunocytochemistry (ICH) of PD-L1 expression on the surface of MoDC. MoDC were treated for 24 h with 1,000 U/ml IFNα and analyzed with flow cytometry. Alternatively, cytospin slides were produced and ICH was performed using an anti-PD-L1 primary antibody followed by a biotinylated secondary antibody. FACS histograms (red-control, blue-IFNα) and ICH pictures are representative for independent experiments. (C) Cytokines in the supernatant of the IFNα-treated DC analyzed with Luminex assays. The results are presented as column bar graphs and statistically analyzed using unpaired T-test, n = 2.

