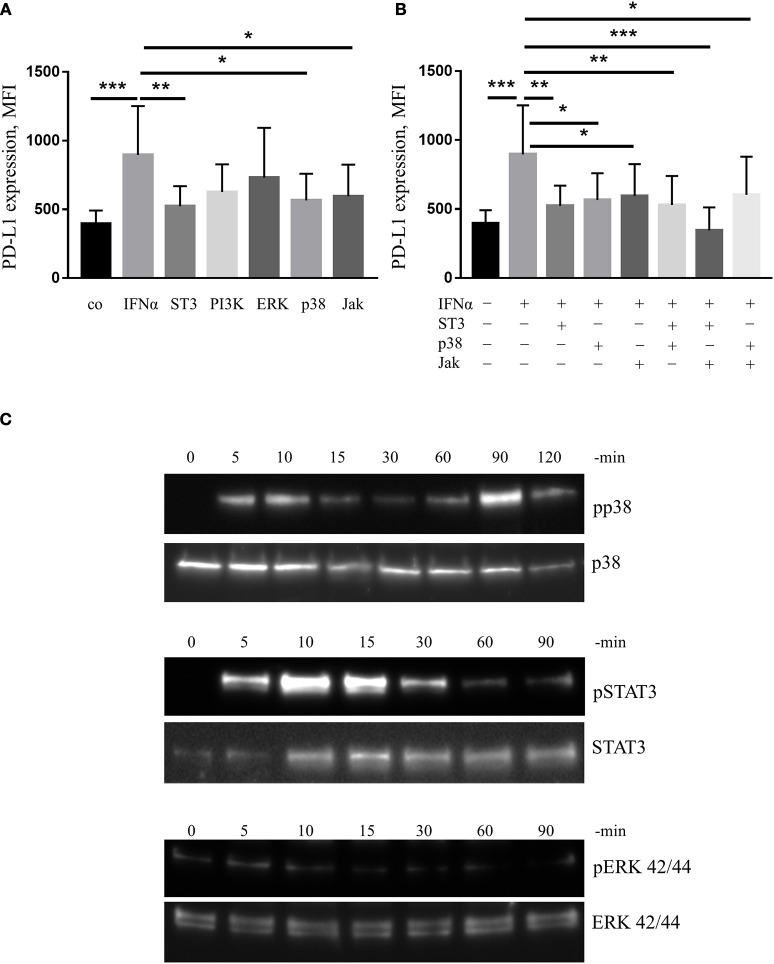
Figure 6.
IFNα up-regulates PD-L1 expression in mDC in p38/STAT3-dependent manner. (A,B) FACS analysis of PD-L1 expression on mDC activated for 24 h with 1,000 U/ml IFNα with or without 1 h pre-incubation with signal transduction inhibitors of p38, STAT3 (ST3), PI3K, ERK, p38, and Jak. The results are presented as column bar graphs and statistically analyzed using ordinary one-way ANOVA with the Dunnett's multiple comparisons post-test, n = 8–10, *p < 0.05, **p < 0.01, and ***p < 0.001. (C) Western blot analysis of p38, STAT3, and ERK phosphorylation (pp38, pERK, and pSTAT3 for phosphorylated form) in mDC before and after activation for indicated period of time with IFNα.

