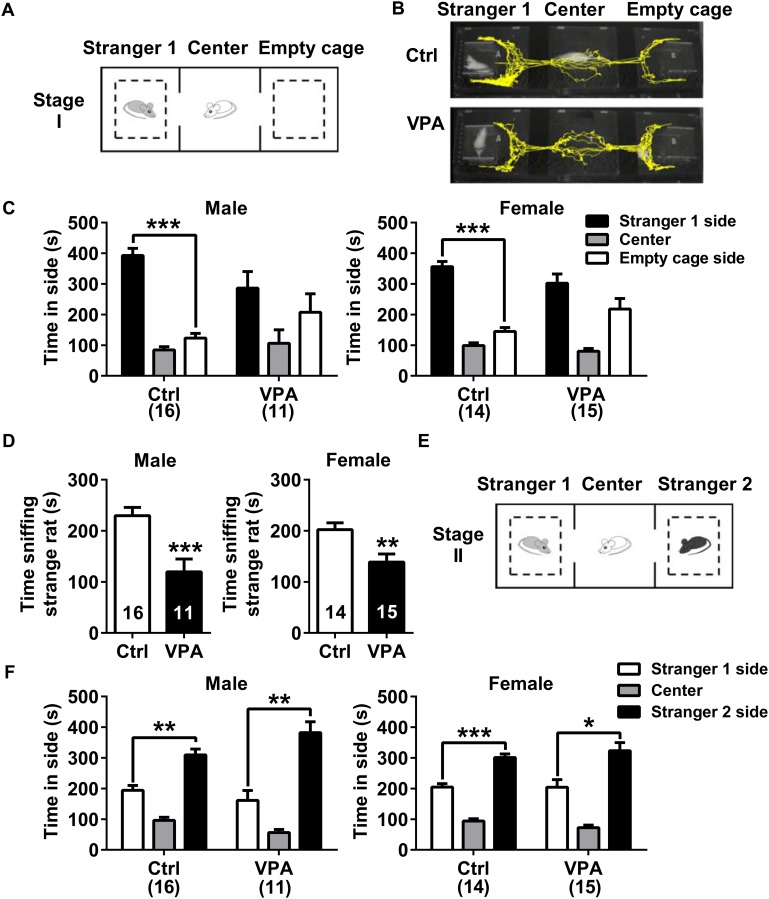
FIGURE 2.
Social interaction in control and VPA rats. (A–D) Stage I of three-chamber sociability test (social preference). (A) The paradigm for testing social preference. (B) Representative traces from control and VPA rats exploring the two sides (Stranger 1 and empty cage). Both the males (n = 11) and females (n = 15) in the VPA group exhibited deficits in social preference (C) and spent less time sniffing the stranger (D) than the control group (male n = 16, female n = 14). (E,F) Stage II of three-chamber sociability test (social novelty). (E) The paradigm for testing social novelty. (F) No differences were observed between VPA and control rats of both sexes in the social novelty test. Data are expressed as mean ± SEM, ∗P < 0.05, ∗∗P < 0.01, ∗∗∗P < 0.001. Ctrl, control.

