FIGURE 3.

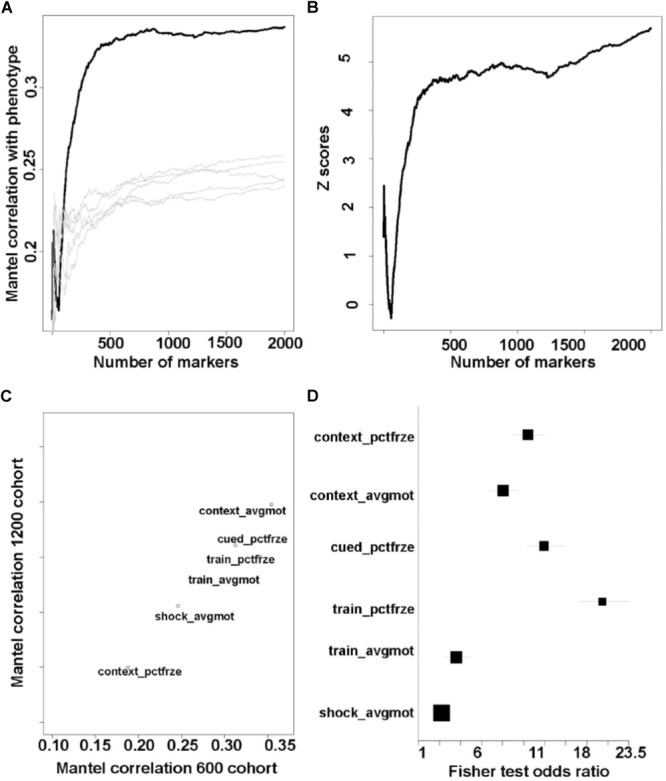
Significant markers sets are robustly detected in the two cohorts. These results illustrate that our QTL set detection procedure returns consistent results even under highly heterogeneous testing conditions. (A) Black line: QTL detection procedure applied to the context_avgmo phenotype. As more markers are included in the analysis the Mantel correlation reaches a plateau. When the same analysis is run on randomized order samples, the cumulative correlation does not reach significant values (gray lines). (B) Z-scores computed on the basis of the data in A (black line compared with gray lines). As more markers are included in the analysis, the Z-scores increase above 3, signifying that correlation values in A are unlikely to be achieved by chance alone. (C) Top genotype–phenotype values for the two cohorts are largely the same. (D) Overlap between significant markers detected independently in the two cohorts. For all phenotypes the size of overlap is significantly higher than what can be achieved by chance alone (confidence intervals for odds ratios >> 1). P-values in order from top to bottom: 8 × 10-250, 7 × 10-159, 5 × 10-255, ∼0, 1.06 × 10⁻²⁴, 3 × 10-18.
