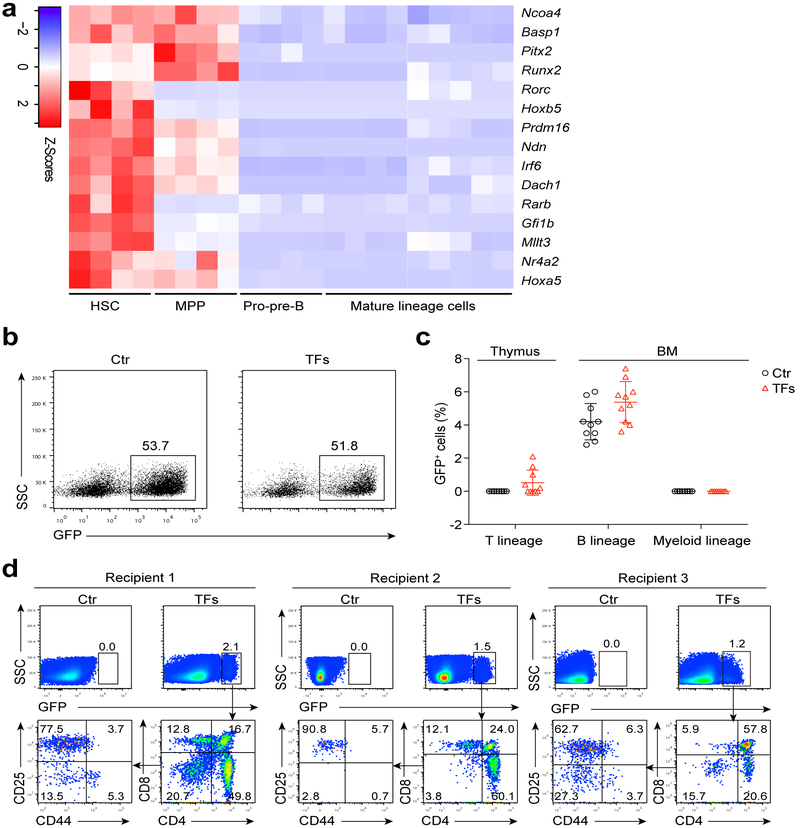
Figure 1. Screening for transcription factors involved in B to T cell conversion.
(a) Heatmaps of 15 transcription factors (TFs) preferentially-expressed in HSC and MPP, but not in pro-pre-B, mature T or B or myeloid cells. RNA-Seq was performed on 1000 cells of each cell type. HSC (n = 4 biologically independent samples), MPP (n = 4 biologically independent samples), pro-pre-B (n = 4 biologically independent samples), mature lineage (n = 9 biologically independent samples). Genes for Heatmaps were screened by the principle of pairwise comparison (Significance: fold change > 2, P < 0.05, two-sided-independent Student's t test). The fpkm values for each of 15 TFs were converted to z-score values (red, high; blue, low), and the heatmaps were plotted by gplots (heatmap.2). Columns represent the indicated biological replicates of each population. (b) Representative flow cytometry analysis of Ter119−Mac1−CD3−CD4−CD8−B220+CD19+CD93+IgM− pro-pre-B cells transduced with empty cassette or 15 TF cocktail virus. Numbers above the gate indicate percent GFP+ cells, (c) Percentage of GFP+ cells in T lineage (thymus), B lineage and myeloid lineage (BM) of control-virus-transduced pro-pre-B cell recipients (n = 10 mice) and 15-TF-transduced pro-pre-B cell recipients (n = 10 mice) four weeks post-transplantation. Small horizontal lines indicate the mean (± s.d.). (d) Flow cytometry analysis of GFP+ lymphocytes in the thymus of 15-TF-transduced pro-pre-B cell recipient mice and control recipient mice four weeks post-transplantation (n = 3 mice). Data are representative of four independent experiments (b) or are pooled from two independent experiments (c).

