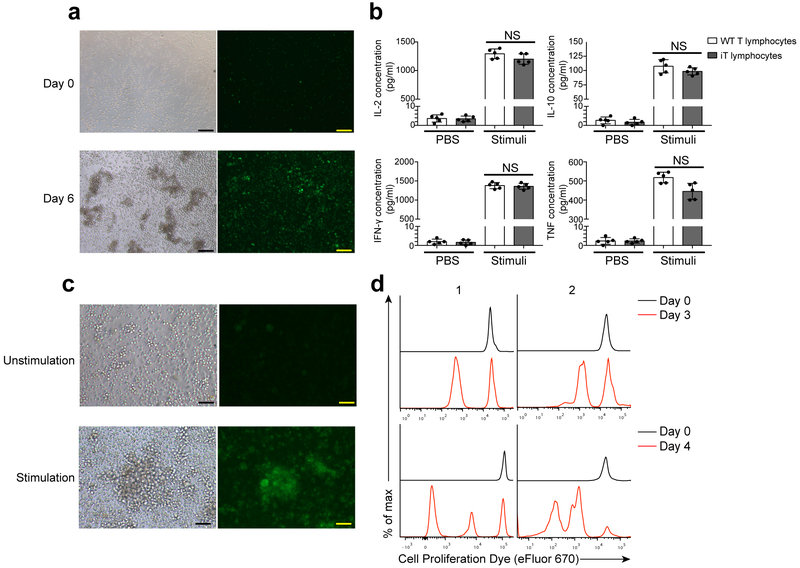
Figure 4. Immune functions of Hoxb5-induced iT lymphocytes.
(a) Morphology of iT proliferation assay stimulated by anti-CD3 and anti-CD28 mAbs. Scale bar, 100 μM. (b) ELISA analysis of IL-2, IL-10, IFN-γ and TNF secreted by splenic iT lymphocytes after stimulation in vitro. Splenic iT lymphocytes were sorted (0.2 million/well, 96-well plate) and stimulated by anti-CD3 mAb (50 μg / ml) and anti-CD28 mAb (5 μg / ml) for 6 days. Each symbol represents an individual sample, and small horizontal lines indicate the mean (± s.d.). (NS, not significant (P > 0.05) two-sided-independent t-test, n = 5 biologically independent samples). (c) Morphology of iT blasts stimulated by inactivated allogeneic splenocytes (BALB/c mouse) on day 7. Scale bar, 100 μm. (d) Flow cytometry analysis of proliferative CD4+ iT lymphocytes in mixed lymphocyte reaction assay. Splenic iT lymphocytes from representative Hoxb5-Rag1−/“ mice with (1) /without (2) allogeneic skin transplantation were analysed. Half million sorted splenic iT lymphocytes were stained by cell proliferation dye eFluor 670, then co-cultured with 0.5 million inactivated allogeneic splenocytes (BALB/C) in individual wells (96 well plates). After three to four days, the cells were collected and analysed by flow cytometry. Data are representative of three independent experiments (a, c, d) or are pooled from two independent experiments (b).

