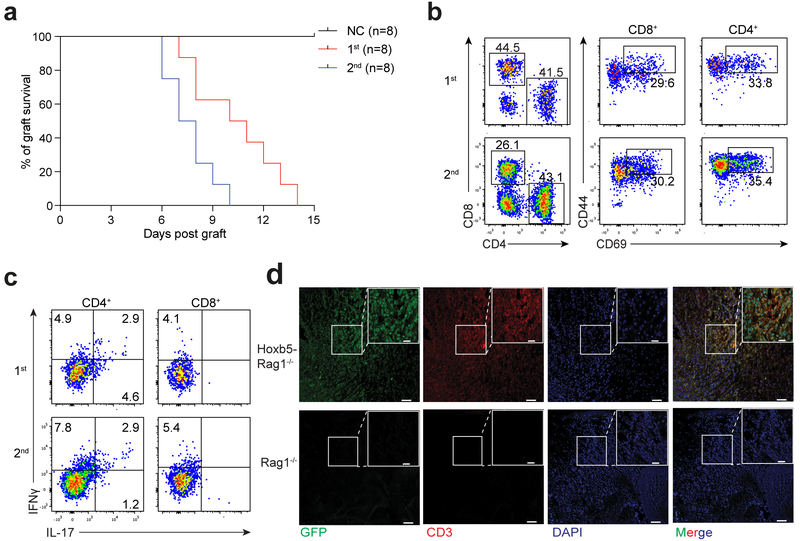
Figure 5. Hoxb5-induced iT lymphocytes show normal immune functions in vivo.
(a) Kaplan-Meier survival curves of allogeneic skin grafts from Rag1−/− (NC group, n = 8 mice) and Hoxb5-Rag1−/− mice (n = 8 mice). Median allogeneic graft survival: Primary allograft from Hoxb5-Rag1−/− = 10.5 d (1st group, n = 8 mice); Secondary allograft from Hoxb5-Rag1−/− = 7.5 d (2nd group, n = 8 mice) (P value < 0.001, Log-rank test). Time interval between primary and secondary allogeneic skin graft = 8 weeks. (b) Flow cytometry analysis of activation status of Hoxb5-induced iT lymphocytes in the allogeneic skin graft. Representative plots from rejected primary allogeneic skin grafts (1st, day 10) and rejected secondary allogeneic skin grafts (2nd, day 6) were shown. Single cells were harvested from rejected skin tissues by collagenase I digestion. Activated iT cells were defined as CD45.2+Ter119−Mac1−CD19−CD4+CD44hiCD69+ or CD45.2+Ter119−Mac1−CD19−CD8+CD44hiCD69+. (c) Intra-cellular staining of IFNμ and IL-17 in the activated CD45.2+ CD4+ or CD8+ iT lymphocytes from the allogeneic skin grafts. Representative plots from rejected primary allogeneic skin grafts (1st, day 10) and rejected secondary allogeneic skin grafts (2nd, day 6) were shown. (d) Immunofluorescence staining of GFP+ CD3+ iT lymphocytes in allogeneic skin grafts. Images from representative allogeneic skin tissue sections from Rag1−/− and Hoxb5-Rag1−/− mice were shown. Scale bars, 20 μm or 50 μm. Data are representative of three independent experiments (b-d).

