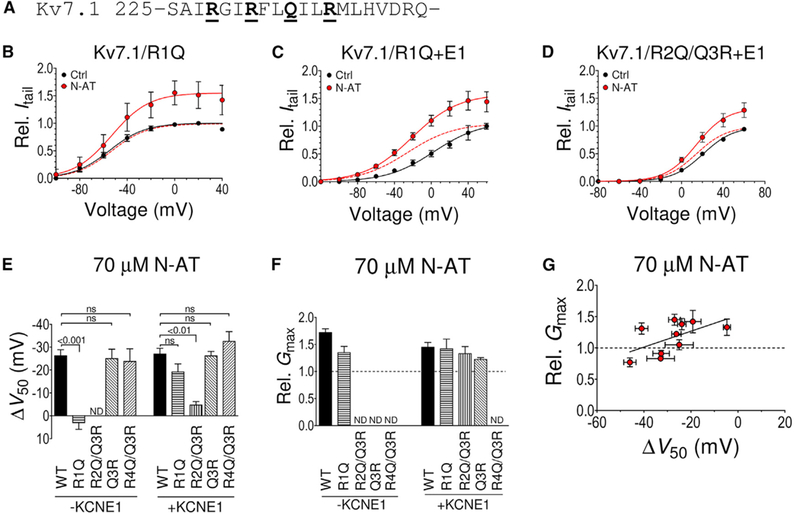
Figure 2. Independent PUFA Analog Effects on Gmax and V50.

(A) Primary structure of human Kv7.1 transmembrane helix S4. The underlined bold residues denote S4 arginines R1-R4. Note that the residue at position R3 is uncharged in Kv7.1.
(B) Lack of effect of N-AT (70 μM) on V50 of Kv7.1/R1Q, but retained N-AT effect on Gmax. n = 6. V50 (mV): control = −55.1 ± 2.5; N-AT = −53.2 ± 3.9. The dashed line is the N-AT curve normalized to 1 to facilitate comparison of V50.
(C) Retained effect of N-AT (70 μM) on V50 and Gmax of Kv7.1/R1Q+E1. Same color coding as in (B). n = 6. V50 (mV): control = +2.7 ± 6.1; N-AT = −25.8 ± 5.0.
(D) Dramatically reduced effect of N-AT (70 μM) on V50 of Kv7.1/R2Q/Q3R+E1, but retained N-AT effect on Gmax. Same color coding as in (B). n = 7. V50 (mV): control = +20.6 ± 2.7; N-AT = +14.2 ± 2.5. Small error bars are covered by symbols.
(E) Summary of N-AT effect (70 μM) on V50 of S4 arginine mutants with and without KCNE1 co-expression. Note that an arginine at the Q3 position is not able to rescue the N-AT effect on V50 in Kv7.1/R2Q. The Q3R and R4Q mutations do not affect the ability of N-AT to shift V50 of Kv7.1 without or with KCNE1 co-expressed.
(F) Summary of N-AT effect (70 μM) on Gmax of S4 arginine mutants with and without KCNE1 co-expression. ND, not determined. Effects on Gmax of R4Q/Q3R could not reliably be determined as control and N-AT recordings were performed on different oocytes (Experimental Procedures). Effects on Gmax ofQ3R without KCNE1 could not be reliably determined because of small currents. Statistics in (E) and (F) calculated using one-way ANOVA followed by Tukey’s multiple-comparison test to compare all columns (there was no statistical difference forany mutant compared to WT in F).n = 4/6/5/4/6/9/5/5/4 in (E) and 4/6/6/9/7/5 in (F).
(G) Graph illustrating lack of correlation between N-AT effects on V50 and Gmax. Included data: WT+E1, S4 mutants (R1Q+E1, R2Q/Q3R+E1, and Q3R+E1), and 326 mutants (K326C+E1, K326C++E1, K326C−+E1, K326Q+E1, K326R+E1, and K326E+E1). n as in Figures 1F, 2E, and 2F. The solid line represents linear regression, for which the slope is not significantly different from 0 (p = 0.18). Data are represented as mean ± SEM.
See also Figure S1
