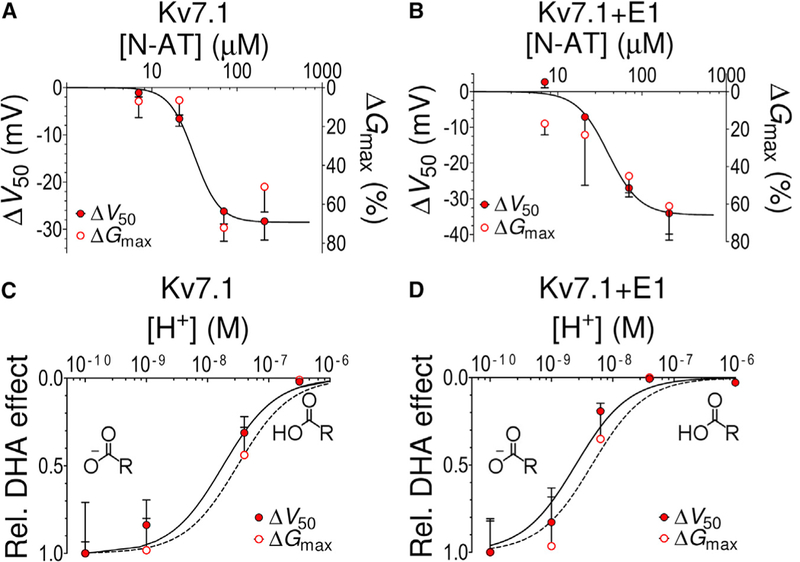
Figure 3. Similar Concentration and pH Dependence for Effects on Gmax and V50.

(A and B) Concentration-response curve for N-AT-induced shift of V50 (closed symbols) and increase in Gmax (open symbols) of (A) Kv7.1 and (B) Kv7.1+KCNE1. The continuous line is the best fit of ΔV50 data to Equation 2, with (A) c50 = 31.3 ± 6.8 μM, NH = 2.9, and n = 4 for each data point, and (B) c50 = 39.7 ± 13.2 μM, NH = 2.3, and n = 5 for each data point. c50 for the Gmax data could not be determined because of difficulties to reliably determine the Gmax effects at the lowest N-AT concentrations. The steep slope of the concentration-response curves (NH = 2.3-2.9) could partly be explained by cooperativity in the N-AT effect. Most of the steepness of the concentration-response curve is, however, most likely due to our inability to load more N-AT into the cell membrane at N-AT concentrations above 70 μM, either because of micelle formation by N-AT or because of electrostatic repulsion between membrane-incorporated N-AT molecules at high N-AT concentrations.
(C and D) Normalized pH dependence of DHA-induced (70 μM) shift of V50 (closed symbols) and increase in Gmax (open symbols) of (C) Kv7.1 and (D) Kv7.1+KCNE1. The continuous line is the best fit of ΔV50 data to Equation 2, with (C) c50 = 1.8 × 10⁻⁸ M (=pH 7.7, from Liin et al., 2015b) for ΔV50 and c50 = 3.1 × 10⁻⁸ M(=pH 7.5) for ΔGmax; NH = 1, and (D) c50 = 2.5 × 10⁻⁹ M(=pH 8.6, from Liin et al., 2015b) for ΔV50 and c50 = 4.4 × 10⁻⁹ M (=pH 8.4) for ΔGmax; NH = 1. The insets in (C) and (D) illustrate deprotonated and protonated DHA head groups. n = 3-13 for each data point. Error bars denote SEM.
See also Figure S3.
