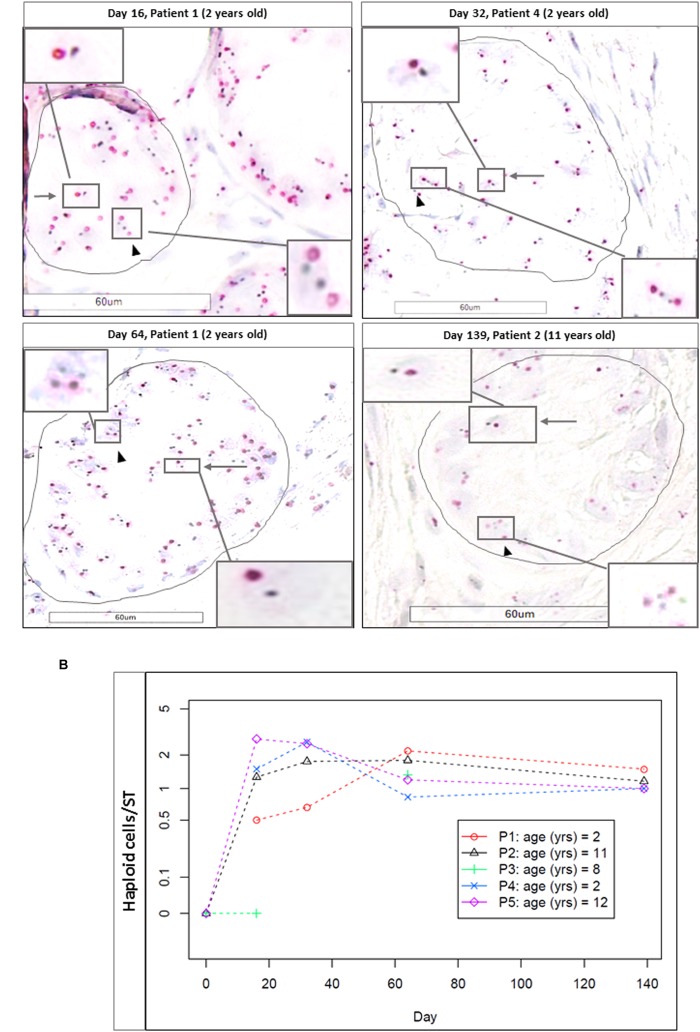
FIGURE 11.
Haploid cells evidenced zzby CISH. (A) Shows the CISH-stained cells (magnification ×400) at different timepoints (D16, D32, D64, and D139). Arrows indicate haploid cells, identified as two stained spots (in red for Ch17 and in black for HER2). Arrow heads show diploid cells, characterized by the presence of four spots. Cutouts give images at higher magnification (×600). Haploid cells were found in the adluminal compartment, while diploid cells were found on the basement membrane, underlined in black. (B) Shows the number of the haploid cells per ST for each patient, and as no differences were observed between the two culture media, we reported the results as a mean between M1 and M2. No haploid cells were found at day 0.

