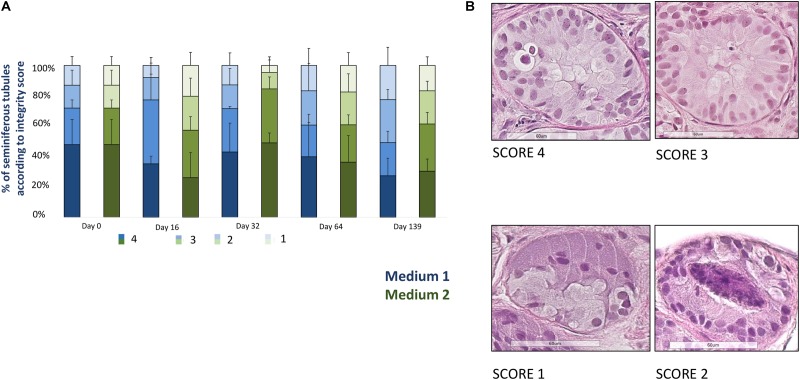
FIGURE 2.
Tissue integrity. (A) Shows the evolution of seminiferous tubules (STs) integrity for each culture time point, represented as the percentage of STs classified according to a scoring system where score 4 corresponds to the best STs integrity and score 1 to the worst integrity. Four parameters were used to assign a ST to a given score: adhesion of cells to the basement membrane, cell cohesion, proportion of pyknotic nuclei (less than 5% of total), and easy distinction of germ cells and Sertoli cells. The histogram bars colored in blue correspond to medium 1 and those in green to medium 2. A statistical significant reduction (p = 0.02) of the well preserved STs (score 3 + 4), evaluated in four slides for each timepoint and each culture media in all the patients, was observed, without any difference between the two culture media. (B) Illustrates four examples of tubules from the best to the worst score (from 4 to 1). The tubule reported as score 4 shows an easy distinction between Sertoli cells and germ cells, a good cohesion and adhesion of cells to the basement membrane, while the tubule with a score 3 contains pyknotic nuclei within the lumen. The tubule reported as a score 2 presents pyknotic nuclei within the lumen and lack of cell cohesion, while the score 1-tubule shows necrosis at the middle of the tubule and lack of cell cohesion and adhesion.

