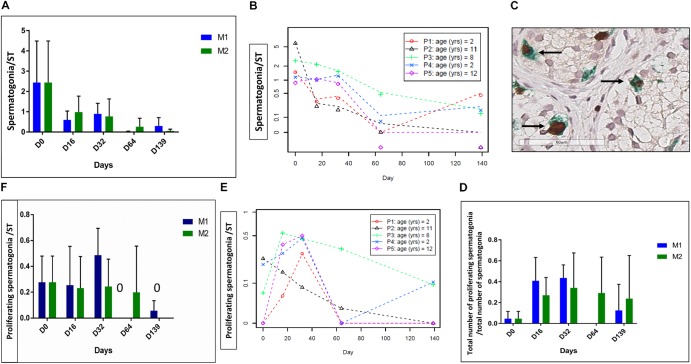
FIGURE 3.
Spermatogonia survival and proliferation. The figure shows the survival and proliferation of spermatogonia (SG) at the different culture timepoints. (A,F) Shows the results -expressed as the mean ± SD between the five patients- of the spermatogonial number per ST (A) and of the number of proliferative SG, identified as double-stained MAGE-A4 and Ki67-positive cells per tubule (F). Moreover, as no statistical difference was found between the two culture media, the same data are reported also for each patient, as a mean between the two media in (B,E). A statistically significant reduction was observed for both parameters (p ≤ 0.001 for the spermatogonial number per ST and p ≤ 0.01 for the number of proliferative SG per ST). The ratio of proliferative SG, calculated as the ratio between the number of proliferative SG and total number of SG, is shown in (D), and it did not change during the culture period. (C) Shows the double staining MAGE A4-Ki67 where proliferative spermatogonia are pointed by an arrow.

