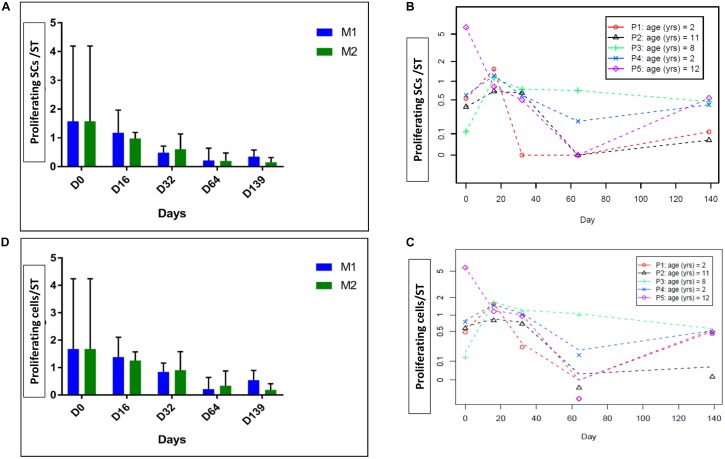
FIGURE 4.
Intratubular cell proliferation. The figure shows the proliferation of intratubular cells and proliferating SCs at the different culture timepoints. (A) Shows the evolution of proliferating SCs per ST and (D) shows the evolution of proliferating cells per ST, both parameters expressed as a mean between the five patients. (B,C) Shows the same results expressed for each patient, where data are presented as a mean between the two culture media as no statistical difference was found between the two media. We observed a statistically significant reduction in the number of proliferative SCs over the culture period (p = 0.04) and in total intratubular Ki67-stained cells (p = 0.04).

