FIGURE 7.
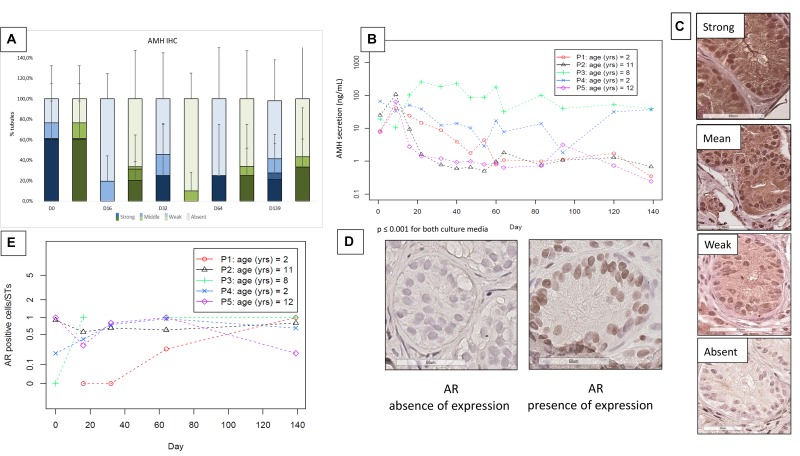
Anti-Müllerian hormone (AMH) expression and secretion (Figures 5a–c) and androgen receptor (AR) expression (Figures 5d,e). (A) Illustrates IHC expression of AMH, evaluated via a semiquantitative score, where the darkest colors represent the strongest staining of the marker, with a progressive decrease in color intensity corresponding to the decrease in IHC staining (in blue for medium 1 and in green for medium 2). The “strong and moderate” expression of AMH showed a trend in diminution, without significant change. (B) Shows AMH secretion in the supernatants, where – as no statistical difference was found between the two culture media- the data are reported for each patient as a mean between the two media, with a significant decrease during the culture period (p ≤ 0.001). (C) Shows the different intensity of staining of AMH from strong (in the top) to absent (at the bottom of the figure). The images were taken from the strong to the absent staining in patient P2 day 16, P1 day 64, P5 day 64, and day 139, respectively. (E) Illustrates the evolution of AR stained cells per ST, which did not show a significant change along the culture. We reported the values for each patient, calculating the mean between the two culture media as they did not show any statistical difference. The absence and presence of AR expression is illustrated in (D).

