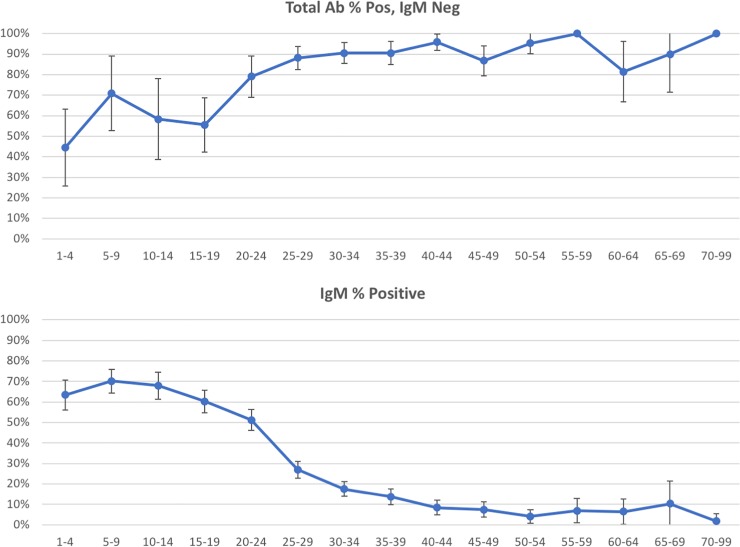
Fig 1. Age analysis for Hepatitis A antibody.
The top panel shows the percent of positive tests by age category in five year increments. Age less than one year is omitted because of small numbers and the potential for maternal antibody to affect the total antibody results. All patients above 70 years are grouped together because of small numbers. The lower panel consists of the patients who had both IgM and total antibody performed and whose IgM was negative. The error bars demonstrate the 95% confidence intervals.

