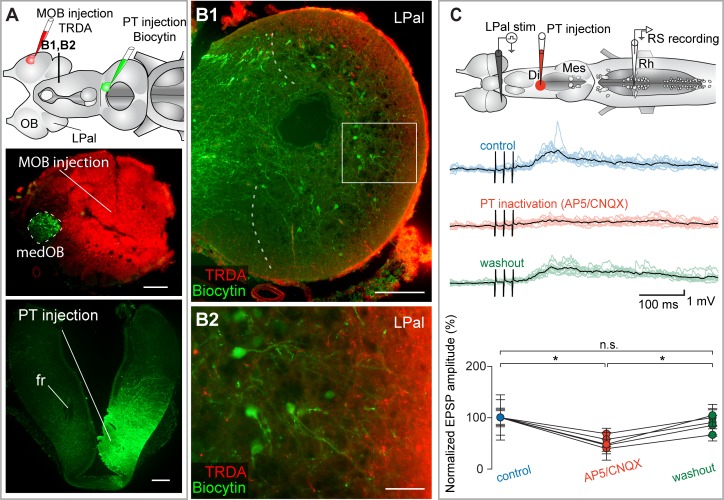
Fig 8. The LPal inputs to RS neurons are relayed in the PT.
(A) Top: schematic representation of the brain illustrating the tracer injection sites and the level of the cross section shown in B. Bottom: the injection sites are illustrated on cross sections. Many projection neurons (green), found only in the medOB, are retrogradely labeled from the PT injection. (B1) Many neurons (in green) are retrogradely labeled in the LPal after a tracer injection in the PT. Descending fibers labeled from an MOB injection are superimposed (red). The medial border of the LPal is indicated by curved dashed lines. (B2) High magnification of the boxed area in B1 showing dendrites of neurons projecting to the PT (green) extending towards the descending fibers from the MOB (red). (C) Top: schematic illustration of the brain showing stimulation, injection, and recording sites. Middle: RS neuron responses to electrical stimulation (15–20 μA) of the LPal. A local injection of the glutamate receptor antagonists AP5/CNQX (0.5 mM/1 mM) in the PT (see schematized brain, upper panel) strongly decreased the RS neuron responses. Each black trace is a mean of 10 individual responses (colored traces). Bottom: univariate scatterplot showing the normalized (as a percentage of control) EPSP amplitude in control, AP5/CNQX, and washout conditions for all animals. An asterisk (*) indicates a statistically significant difference at the level p < 0.05, while n.s. indicates the absence of statistically significant difference. The numerical values underlying this figure can be found in S1 Data. Scale bars in A, B1 = 200 μm; scale bar in B2 = 50 μm. AP5, 2-amino-5-phosphonopentanoic acid; CNQX, 6-cyano-7-nitroquinoxaline-2,3-dione; Di, diencephalon; EPSP, excitatory postsynaptic potential; fr, fasciculus retroflexus; LPal, lateral pallium; medOB, medial part of the olfactory bulb; Mes, mesencephalon; MOB, main olfactory bulb; PT, posterior tuberculum; Rh, rhombencephalon; RS, reticulospinal; stim, stimulation; TRDA, Texas Red-conjugated dextran amine.

