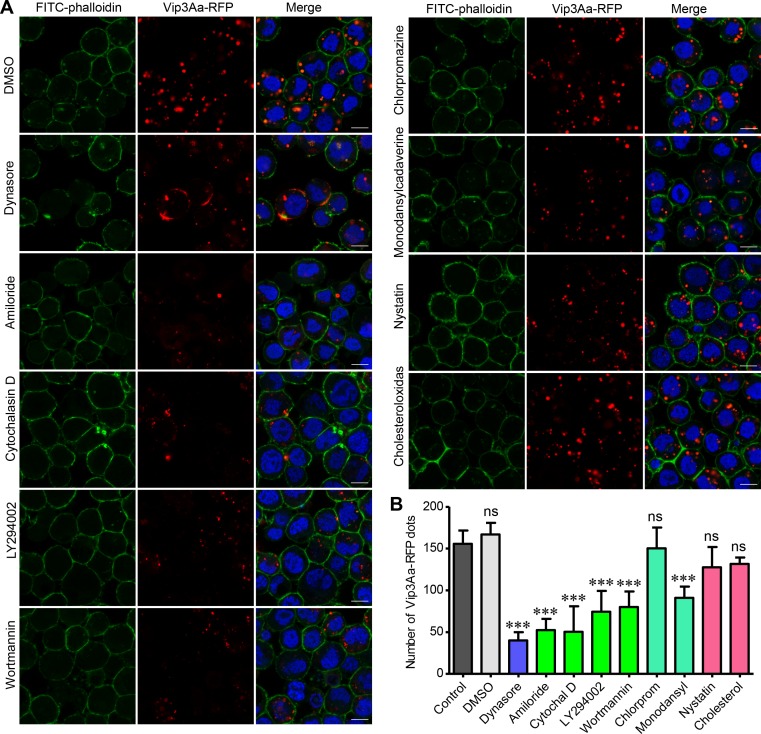
Fig 5. Vip3Aa entry into Sf9 cells via endocytosis.
(A) Confocal images showing Vip3Aa-RFP dots in Sf9 cells. Cells were pre-treated with different inhibitors for 1 h and then co-incubated with Vip3Aa-RFP (4.5μg/ml) for 6 h. Nuclei are stained with DAPI (blue) and cell membrane are stained with FITC-phalloidin (green). Scale bar, 10 μm. (B) Quantification of the number of conspicuous Vip3Aa-RFP dots in Sf9 cells of (A) in a blind fashion (n = 60 cells per sample). Cytochal D: Cytochalasin D, Chlorprom: Chlorpromazine, Monodansyl: Monodansylcadaverine, Cholesterol: Cholesteroloxidas. Data are expressed as the mean ± SD from three independent experiments; ns, non-significant; *** P < 0.001; one-way ANOVA using Duncan method.

