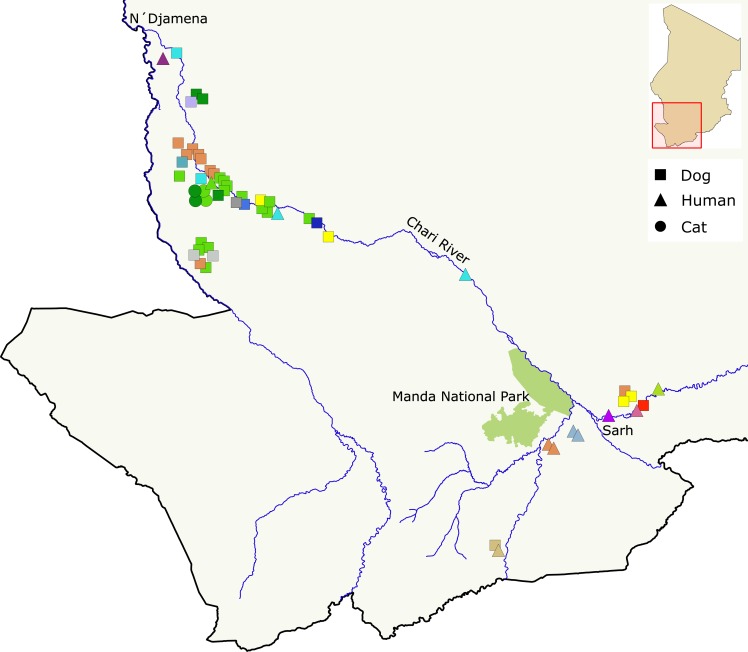
Fig 1. Distribution of mitochondrial haplotypes across Chad and among host species.
Distribution of mitochondrial haplotypes across the geographic range and host species sampled in Chad. Host species are indicated by point shape and mitochondrial haplotype by color. The map was generated with QGIS v2.18.13 [46]. River paths and national park boundaries were extracted from Landsat 8 imagery provided courtesy of the U.S. Geological Survey (http://glovis.usgs.gov/).

