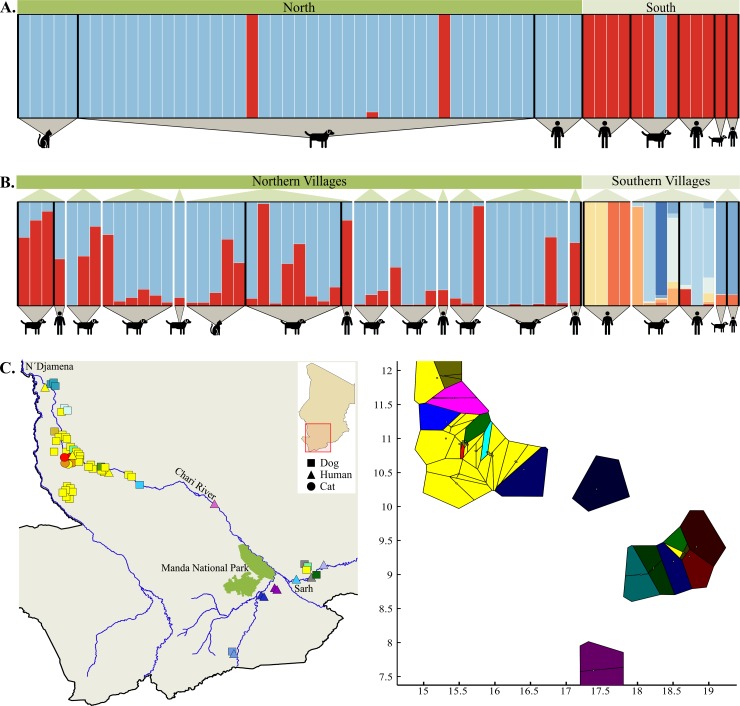
Fig 6. Inference of D. medinensis subdivision among host species and geographic regions within Chad.
(A) Posterior assignment of all D. medinensis worms collected from within Chad into K = 2 clusters of shared ancestry, as inferred using the TI method in MavericK v1.0 to determine most likely K [26]. Each bar represents an individual worm and color indicates proportional assignment to one or more clusters. Individuals have been sorted by geographic region (i.e., north or south of Manda National Park) and definitive host species. (B) Assignment of worms when analysis is restricted by broad geographic region (i.e., north or south of Manda National Park) in MavericK v1.0. Northern worms were assigned into K = 2 clusters and worms from southern villages into K = 8 clusters. Within each geographic region, worms are sorted by village and definitive host species. Bar colors are only informative within each assignment analysis and should not be used for comparison among them. (C) Spatial clustering of individuals in BAPS v6.0 for most likely K = 16. Individual parasites plotted onto the map of the sampling area is depicted on the left, and Voronoi tessellation of clusters is illustrated on the right. Mapped point shape indicates host species and color indicates the cluster to which an individual was assigned. The map was generated with QGIS v2.18.13 [46]. River paths and national park boundaries were extracted from Landsat 8 imagery provided courtesy of the U.S. Geological Survey (http://glovis.usgs.gov/). Note that the cluster coloring scheme is not uniform between the mapped points and tessellation.

