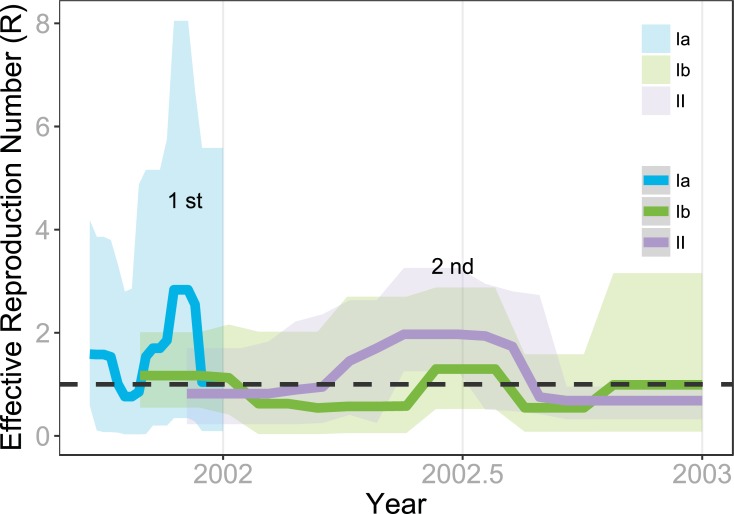
Fig 6. Viral transmissibility of the three groups of DENV-2 variants measured by effective reproductive number (R).
The R (solid line) values and 95% HPD interval (shaded area) from 2001 to 2003 of three DENV-2 viral variants were estimated by birth-death skyline serial analysis. The plot clearly demonstrates that the two peaks of viral transmissibility corresponded well with the two peaks of confirmed DENV-2 cases from 2001 to 2003. The R values of both group Ia and Ib variants surpassed 1.00 during 2001. They were replaced by group II variants when R surged in early 2002, accompanied by the recurrence of group Ib variants.

