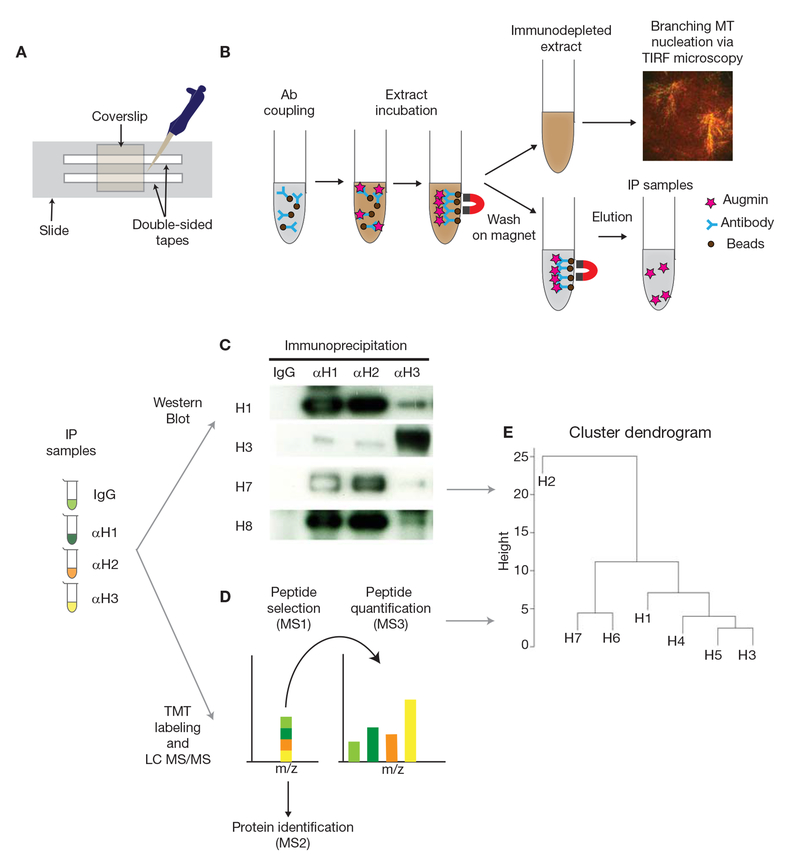
FIGURE 1.
Schematic diagram of the protocol. (A) Preparation of the flow cell. (B) Immunoprecipitation (IP) and immunodepletion (ID) using Protein A Dynabeads and Xenopus egg extracts, followed by the branching microtubule nucleation assay via TIRF microscopy. (C) IP samples obtained using IgG, anti-HAUS1 (αH1), -anti-HAUS2 (αH2), and anti-HAUS3 (αH3) antibodies are analyzed by western blot to quantify the intensities of augmin subunits (H1-8). (D) Quantitative LC MS/MS using IP samples. Sequential mass spectrometry analyses allow identifying augmin subunits and relative amounts in each IP sample. (E) Hierarchical clustering dendrogram is generated by hclust package of R using normalized intensities of augmin subunits in each sample. Seven augmin subunits are depicted as H1-7 (H8 is not identified), showing a putative assembly model for augmin.

