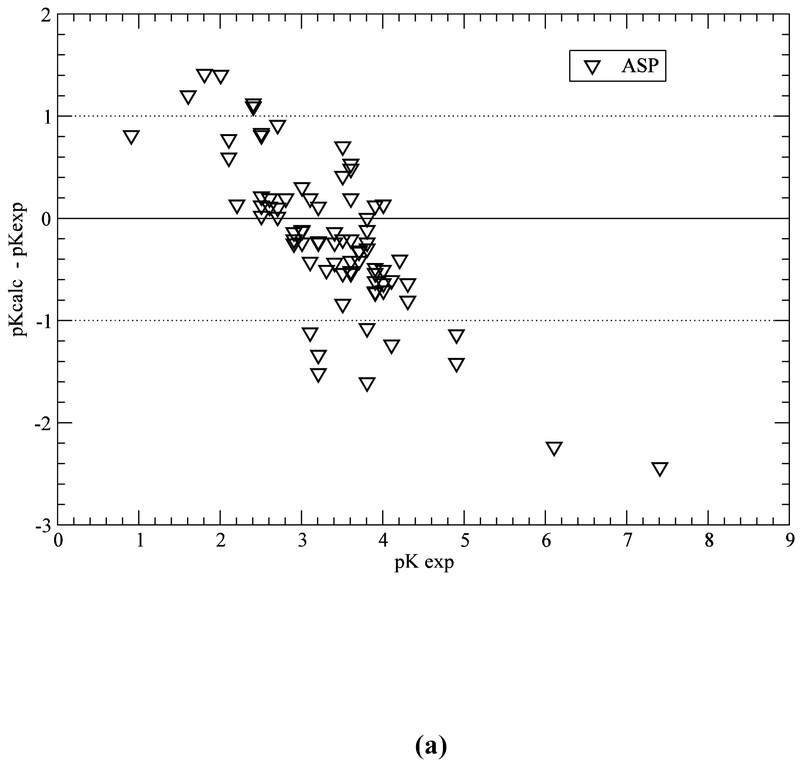
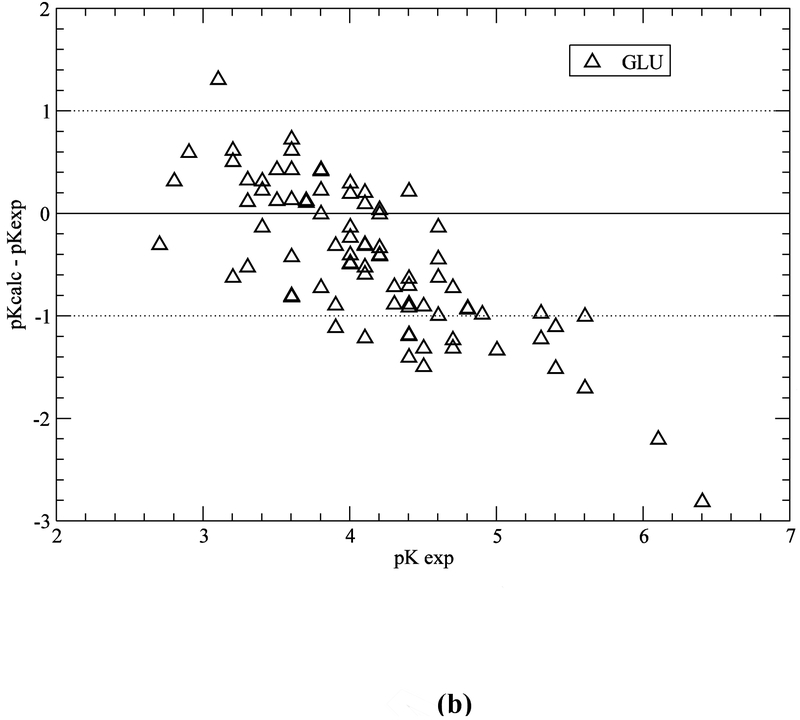
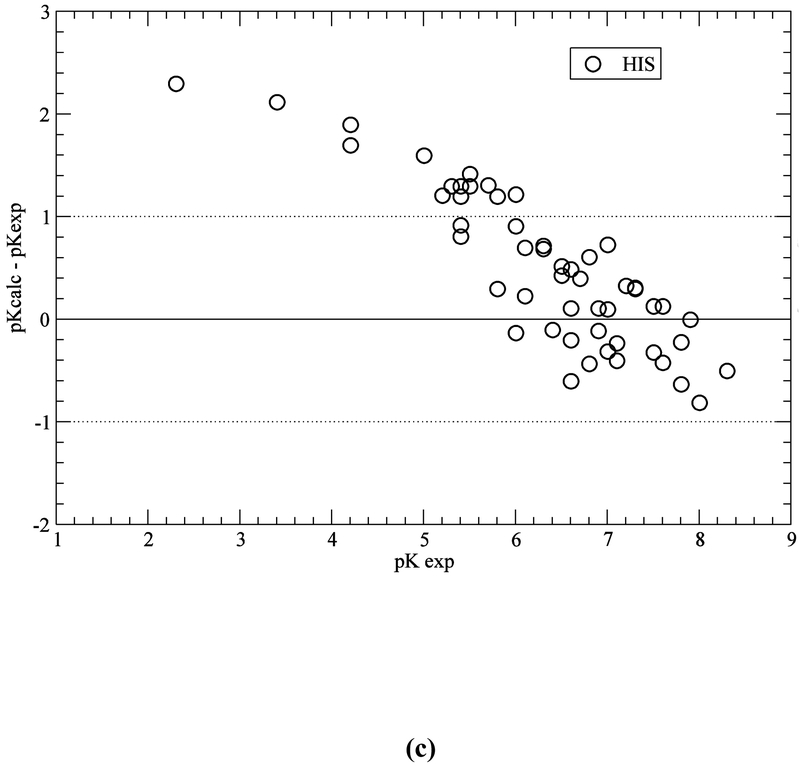
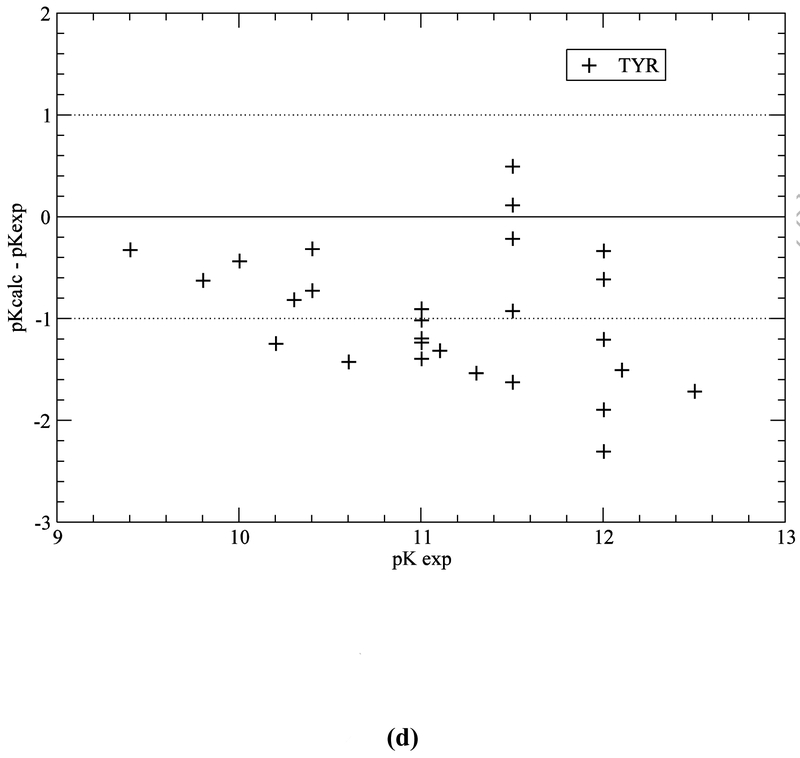
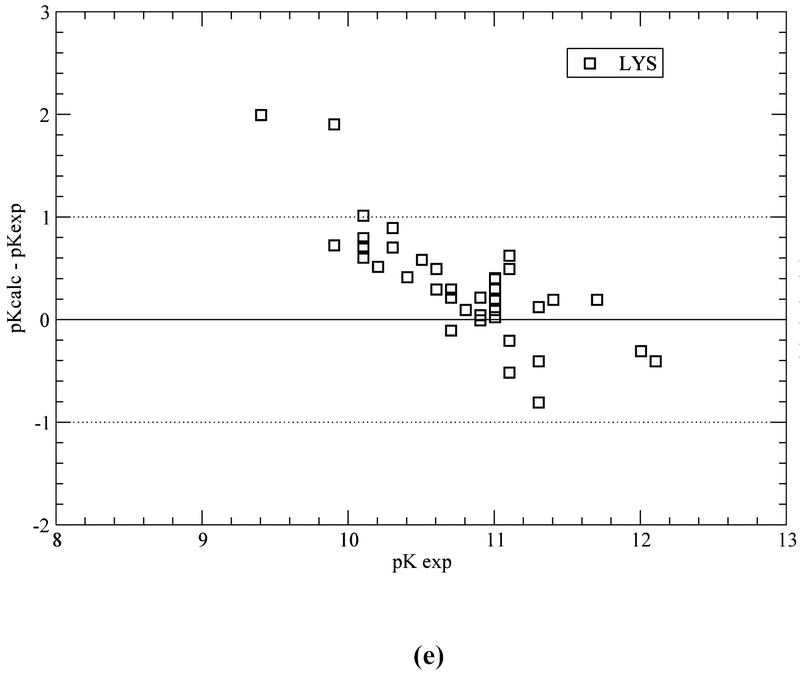
Figure 5.
(a) Accuracy of the pKa predictions for all the ASP residues of the test set of 34 proteins (Table S1 of SM); (b) same as (a) for GLU residues; (c) same as (a) for HIS residues; (d) same as (a) for TYR residues; and (e) same as (a) for LYS residues.

