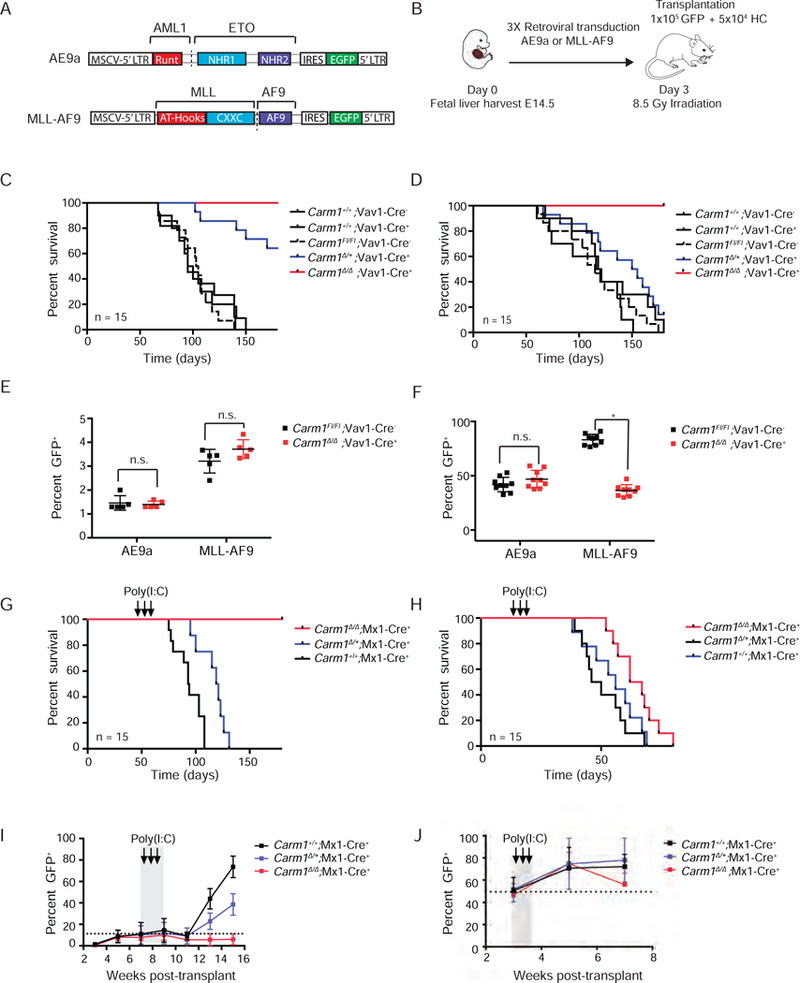
Figure 3: Effects of CARM1 knockout on leukemia initiation and maintenance in fusion oncoprotein-driven models of leukemia.

A) Structure of the MIGR1-AE9a and MIGR1-MLL-AF9 retroviral expression plasmids.
B) Schematic of fetal liver retroviral transduction and transplantation (RTT) model.
C) Kaplan-Meier survival analysis of leukemia initiation AE9a Carm1+/+;Vav1-Cre−, Carm1+/+;Vav1-Cre+, Carm1Fl/Fl;Vav1-Cre−, Carm1∆/+;Vav1-Cre+, Carm1∆/ ∆;Vav1-Cre+ recipient mice. n= 15. Log-rank p value for Carm1∆/∆;Vav1-Cre+ or Carm1∆/+;Vav1-Cre+ recipients compared to CARM1Fl/Fl;Vav1-Cre, p<0.0001. Figure represents 2 independent experiments.
D) Kaplan-Meier survival analysis of leukemia initiation MLL-AF9 Carm1+/+;Vav1-Cre−, Carm1+/+;Vav1-Cre+, Carm1Fl/Fl;Vav1-Cre−, Carm1∆/+;Vav1-Cre+, Carm1∆/ ∆;Vav1-Cre+ recipient mice. n=15. Log-rank p value for Carm1∆/∆;Vav1-Cre+ recipients compared to CARM1Fl/Fl;Vav1-Cre− recipients, p<0.001. Log-rank p-value for Carm1∆/+;Vav1-Cre+ recipients compared to CARM1Fl/Fl;Vav1-Cre− recipients, n.s. = no significant difference. Figure represents 2 independent experiments.
E) Homing of AE9a and MLL-AF9 expressing Carm1∆/∆;Vav1-Cre+ or CARM1Fl/Fl;Vav1-Cre− fetal liver cells in the BM of CD45.1 recipient mice, 16 hr post tail vein injection. n=5, *p< 0.01, **p< 0.01, n.s = no significant differences
F) Engraftment of GFP+ cells in the BM of CD45.1 recipient mice, 1-month post-transplant. n=10, n.s = no significant difference, *p<0.01
G) Kaplan-Meier survival analysis of leukemia maintenance AE9a fetal liver recipients post-Poly(I;C) injection. n=15. Log-rank p value of Carm1∆/∆;Mx1-Cre+ or Carm1∆/+;Mx1+ recipients compared to CARM1+/+;Mx1-Cre+ recipients, p<0.001.
H) Kaplan-Meier survival analysis of leukemia maintenance MLL-AF9 fetal liver recipients post-Poly(I;C) injection. n=5. Log-rank p value of Carm1∆/∆;Mx1-Cre+ recipients compared to CARM1+/+;Mx1-Cre+ recipients, p<0.01.
I) Percentage of AE9a Carm1+/+;Mx1-Cre+, Carm1∆/+;Mx1-Cre+ or Carm1∆/ ∆;Mx1+ recipient GFP+ cells in the peripheral blood of AE9a mice over time. Time of poly(I:C) induction of CARM1 deletion is indicated. n=15.
J) Percentage of MLL-AF9 Carm1+/+;Mx1-Cre+, Carm1∆/+;Mx1-Cre+ or Carm1∆/ ∆;Mx1+ recipient GFP+ cells in the peripheral blood of AE9a mice over time. Time of poly(I:C) induction of CARM1 deletion is indicated. n=15. All bar graph data represent mean ± SD and p values were determined by a two-tailed Student’s t-test for samples of unequal variance. See also Figure S2 and S3.
