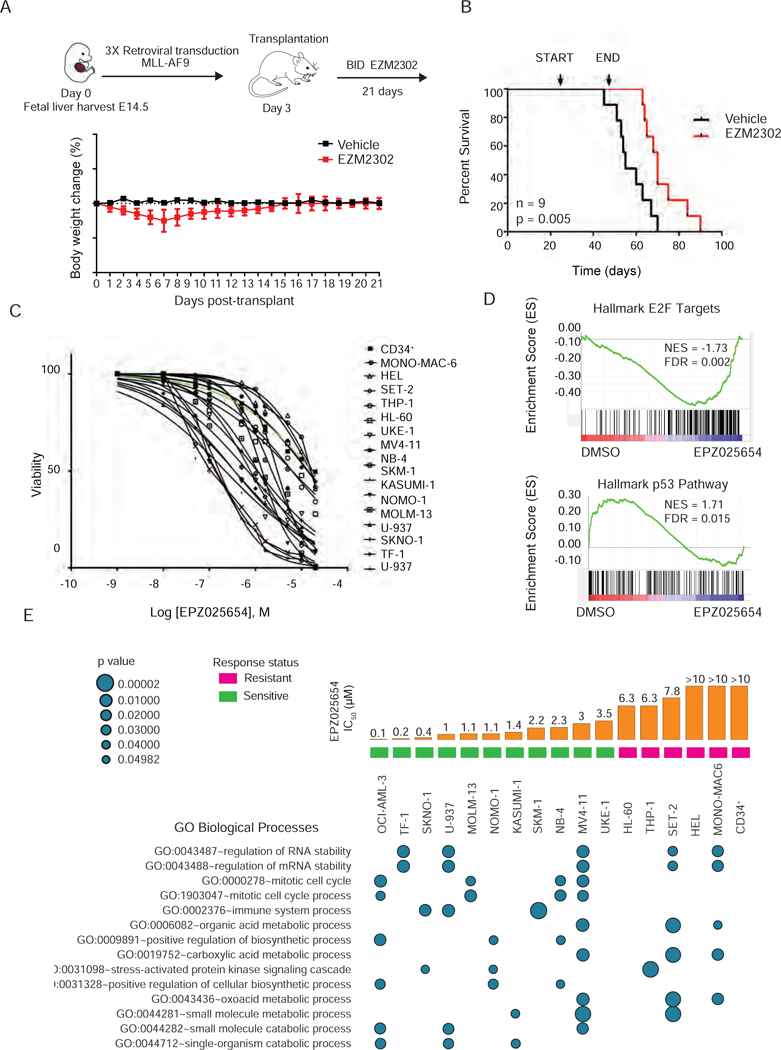
Figure 7. Effects of chemical inhibition on AML cell line viability.

A) Schematic of fetal liver retroviral transduction and in vivo treatment strategy (top). Daily body weight change for mice treated with either vehicle or 100 mg/kg EZM2302 for three weeks. n=9
B) Kaplan-Meier survival analysis of MLL-AF9 fetal liver recipient mice treated with EZM2302 or vehicle for 21 days. Treatment start and end are indicated. n= 9, long-rank p value is 0.005.
C) Dose response for the cellular viability of 16 AML cells lines and CD34+ cells treated in vitro with EPZ025654 for 10 days. IC50 values were calculated using a non-linear regression analysis.
D) Representative GSEA plots depicting the top upregulation of the p53 pathway (NES = 1.71, FDR = 0.015) and down-regulation of E2F targets (NES = −1.73, FDR = 0.002) in SKNO-1 cells treated with EPZ025654 for 7 days. Results are compared to SKNO-1 cells treated with DMSO.
E) Summary of L1000 analysis showing significant gene ontology biological processes enriched in 16 AML cell lines and CD34+ cells treated with 5 µM of EPZ025654 for 6 days. Results represent three biological replicates, and three technical replicates. Bar graphs represent the mean IC50 of three idependent experiments.
