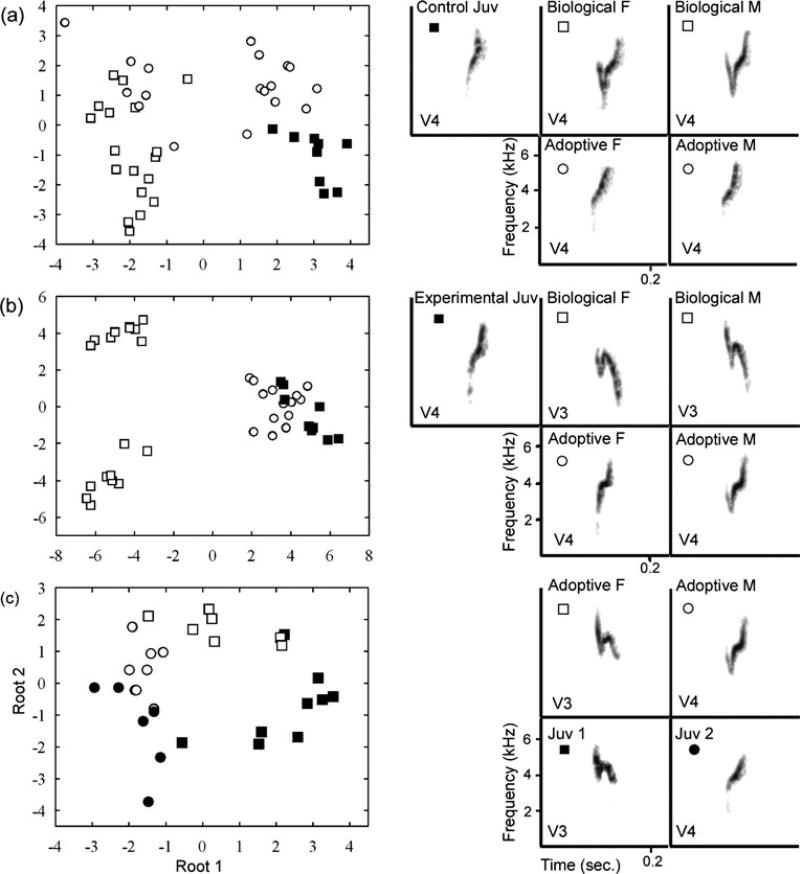
Fig. 4.
Representative spectrograms and LDA plots representing the acoustic space filled by 7±2 calls from each subject and adult in three cross-fostering treatment groups: a a control juvenile (Juv, closed squares), the biological female (F) and male (M, open squares) and the adoptive female and male (open circles), (b) an experimental juvenile, its adoptive and biological parents (same symbols), and (c) two juveniles from the learning biases group (closed squares, closed circles) with the adoptive female of their biological call variant and ecomorph (open squares) and male of a different call variant and ecomorph (open circles). The call variant (V) of each subject is indicated. Note that each LD space is unique to the family analyzed and LDA axes therefore differ across the figure subdivisions

